
What Is Tree Map Chart In Google Sheets?
Tree map chart in Google sheets is one of the inbuilt chart types used to present data visually. Using this tree map chart in Google sheets, we can convert data into hierarchical data with subcategories and parent category.
Remember, tree map chart appears with rectangles and sub-rectangles, each representing the parent category. This chart is useful as it right away shows the category which holds the highest importance.
Use this Tree Map Chart In Google Sheets Template to follow along with the examples in this article.
Download Excel TemplateFor example, consider the below table showing subject and marks of a student in columns A and B, respectively.
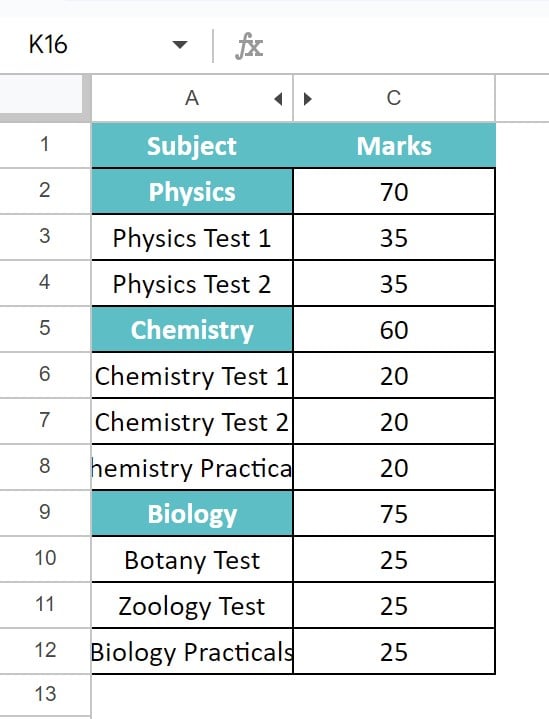
To start with, insert the data in the spreadsheet. In this example, it is inserted in the cell range A1:C12. Now, we have to select the cell range and click on Insert and select Chart option. The Chart editor tab appears at the right end of the screen. Here, click on the Chart Type and click on Tree Map chart option.
We can immediately see the tree map chart as shown in the below image.

Now, if we hover, we can find the data in each of the rectangle.
In this article, let us learn about tree map chart with detailed examples.
Key Takeaways
- Tree map chart in Google sheets helps users graphically represent the data into tree map style with rectangles.
- Users can use this chart type to graphically represent the data into parent rectangles and sub-categorical rectangles.
- It is a default chart type available in Google sheets and it is useful for presenting data based on the impact or value percentage in hierarchical format.
- Remember, we need to insert the parent column with sub-categories to create tree map chart.
Types
The tree map chart can be classified into three categories.
They are:
- Circle Packing Chart
- Sunburst Chart
- Icicle Chart
How To Create A Tree Map Chart In Google Sheets?
Using Google sheets, we can create tree map chart with the following steps.
Step 1: To start with, insert the data in the spreadsheet.
Step 2: Insert an additional column and paste the parent column in the cell range along with the sub-categories. Now, we have to select the cell range and click on Insert and select Chart option.
Step 3: The Chart editor tab appears at the right end of the screen. Here, click on the Chart Type and click on Tree Map chart option.
We can immediately see the tree map chart.
Now, if we hover, we can find the data in each of the rectangle.
Likewise, we can use Tree map chart.
Examples
Let us learn about tree map chart in Google sheets with the following examples.
Example #1 – Tree Map Chart Without Sorting Them Into Categories
For example, consider the below table showing region and units of an organization in columns A and B, respectively.

Now, let us use the data and create tree map chart.
The steps are:
Step 1: To start with, insert the data in the spreadsheet. In this example, it is inserted in the cell range A1:C12.
Step 2: Insert an additional column and paste the parent column in the cell range along with the sub-categories, as shown in the below image.

Now, we have to select the cell range and click on Insert and select Chart option.
Step 3: The Chart editor tab appears at the right end of the screen. Here, click on the Chart Type and click on Tree Map chart option.

We can immediately see the tree map chart as shown in the below image.

Now, if we hover, we can find the data in each of the rectangle.
Likewise, we can use Tree map chart.
Example #2
For example, consider the below table showing semester exams and marks in columns A and B, respectively.

Now, let us use the data and create tree map chart.
The steps are:
Step 1: To start with, insert the data in the spreadsheet. In this example, it is inserted in the cell range A1:C12.
Step 2: Insert an additional column and paste the parent column in the cell range along with the sub-categories, as shown in the below image.

Now, we have to select the cell range and click on Insert and select Chart option.
Step 3: The Chart editor tab appears at the right end of the screen. Here, click on the Chart Type and click on Tree Map chart option.

We can immediately see the tree map chart as shown in the below image.

Now, if we hover, we can find the data in each of the rectangle.
Likewise, we can use Tree map chart.
Example #3
For example, consider the below table showing region and units of an organization in columns A and B, respectively.

Now, let us use the data and create tree map chart in Google sheets.
The steps are:
Step 1: To start with, insert the data in the spreadsheet. In this example, it is inserted in the cell range A1:C12.
Step 2: Insert an additional column and paste the parent column in the cell range along with the sub-categories, as shown in the below image.

Now, we have to select the cell range and click on Insert and select Chart option.
Step 3: The Chart editor tab appears at the right end of the screen. Here, click on the Chart Type and click on Tree Map chart option.

We can immediately see the tree map chart as shown in the below image.

Now, if we hover, we can find the data in each of the rectangle.
Likewise, we can use Tree map chart.
Important Things To Note
- Google sheets tree map chart helps users graphically represent the data into categories.
- It is used to show the data hierarchically based on the values.
- There are three types of tree map charts. They are
- Circle Packing ChartSunburst Chart
- Icicle Chart
Frequently Asked Questions (FAQs)
For example, consider the below table showing region and sales of an organization in columns A and B, respectively.
Now, let us use the data and create tree map chart in Google sheets.
The steps are:
Step 1: To start with, insert the data in the spreadsheet. In this example, it is inserted in the cell range A1:C12.
Step 2: Now, we have to select the cell range and click on Insert and select Chart option.
Step 3: The Chart editor tab appears at the right end of the screen. Here, click on the Chart Type and click on Tree Map chart option.
We can immediately see the tree map chart as shown in the below image.
Now, if we hover, we can find the data in each of the rectangle.
Likewise, we can use Tree map chart in Google sheets.
Tree map chart in Google sheets may not work when the category column is not inserted. We need to make sure to include an additional column and include the parent and sub-categories. Then, we can insert the tree map chart in Google sheets.
We can easily find the data by just selecting the chart and hovering on the rectangles. By default, tree map chart in Google sheets shows the data with a color combination showing highest and lowest data value.
Use this Tree Map Chart In Google Sheets Template to follow along with the examples in this article.
Download Excel Template