
What Is Correlation Matrix in Google Sheets?
A correlation matrix is a table that shows the correlation coefficients between sets of variables. Every cell of the table shows the correlation between two variables. The values range from -1 to 1.
In cases where we want the correlation between more than one pair of variables, we can create a correlation matrix. It is a square table that shows the correlation coefficients between several pairs of variables with different combinations. As seen in the table below, we have a correlation matrix in cells B7:C9.

Use this Correlation Matrix in Google Sheets Template to follow along with the examples in this article.
Download Excel TemplateSyntax
The CORREL function in Google Sheets is used to calculate the Correlation Matrix. The syntax for the CORREL function is as follows:
=CORREL(Array1, Array2)
- Array1: It is the array of values representing the dependent variable in the data set.
- Array2: It is the array of values representing the independent variable in the data set.
The CORREL function determines the correlation coefficient, a value between -1 and 1, which indicates the degree of linear association between the two sets of data.
Interpretation
Positive correlation
- 1 – It indicates a perfect positive correlation, where an increase in one variable causes an increase in the other at a constant rate.
Negative correlation
- -1 indicates a negative correlation, where an increase in one variable causes a decrease in another variable at a constant rate.
No correlation
- 0 indicates no correlation between the two variables.
Therefore, a correlation coefficient of 1 indicates a perfect positive correlation, -1 indicates a perfect negative correlation, and 0 indicates no correlation.
Please not that even if two data sets are highly correlated, there is no confirmation that changes in one variable cause changes in the other.
How to Create a Correlation Matrix in Google Sheets?
Let us look at the steps involved in creating a correlation matrix in Google Sheets with a simple example.
Step 1: Enter your data in Google Sheets. You must arrange each variable in its column and have a header for each column. A correlation matrix has at least 2 variables.
We have a data set that shows the age, qualification and salary few people in a locality.

Step 2: Select an empty cell where the correlation matrix will begin. Let’s start in cell B. Make sure the dataset is placed in the right cells to avoid overwriting the data.
Now, input the CORREL Function for the first pair of variables.
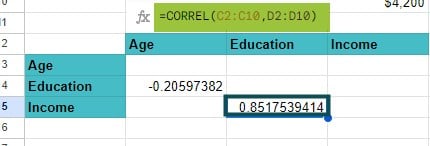
To calculate the correlation between “Age” and “Education,” type =CORREL(B2:B10,C2:C10) into your cell B14. It calculates the correlation between the two variables.

Step 3: To calculate the correlation between “Education” and “Income,” type =CORREL(C2:C10,D2:D10) into the C15 cell. It computes the correlation between these two variables.
Step 4: Now, compute the same for all cells in the matrix.

Let us look at the correlation coefficients. A value close to 1 or -1 indicates a strong positive or negative correlation, while values around 0 indicate a weak correlation.
- As seen, the matrix value for education-income shows a value of around 0.85, indicating a strong positive correlation between education and income.
- Similarly, at -0.06, which is nearer zero, there is no correlation between income and age.
Examples
These examples explain how to create and interpret a correlation matrix in Google Sheets.
Example #1 – Positive correlation
The correlation matrix below can be used to find a correlation between variables in the example below.
The table below shows a student’s number of hours of study and sleep time along with his scores.

Step 1: Find the correlation between these variables. Construct the correlation matrix below this table.
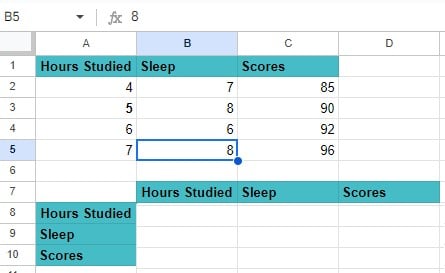
Step 2: Now, let us add the formulas. Let us first complete the diagonal formulas.
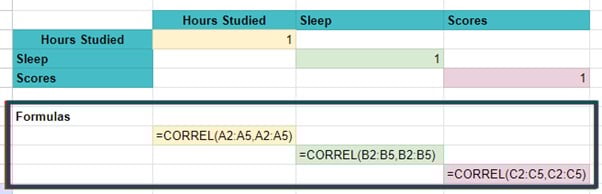
Step 3: Now, let us find the other correlations between other sets of data.

Analysis: All three variables have a positive correlation, and the matrix does not have a negative value.
- As sleep time increases, the score increases slightly.
- A s the hours studied increase, the score increases significantly
Example #2 – Negative Correlation
Let’s say you have a dataset containing a place’s average temperature and pizza sold per day over a week. You must investigate whether there is a correlation between the temperature and pizza sales. Here’s how you do it.
Step 1: First, arrange the data set in a tabular form. We enter the temperatures in Column A and the corresponding pizza sales in Column B. Let us now find the relationship between these two variables.

Step 2: Apply the following formulas in a separate correlation matrix constructed below.

This formula, when applied, shows that the temperature and the pizza have a negative correlation. The higher the temperature, the lesser the sales. It is because people would opt for an ice cream or soda in hot temperatures, perhaps!
Example #3 – No correlation
In this example, let us look at the books purchased for the kids of a family along with the monthly grocery spending. You have the data in a table for six months. We expect no significant linear relationship between these two variables. Let us verify it by understanding how to use CORREL function.

Step 1: Construct the rows and columns for a 2*2 matrix in a suitable cell so that no data is overwritten.

Step 2: Use the CORREL formula in cell B11 as follows:
=CORREL(B2:B7,C2:C7).
Similarly, enter the formulas for the other cells.

In this case, the correlation coefficient is expected to be close to 0, as there is no known linear relationship between the number of books bought and the money spent on groceries anywhere! As expected, the value is close to zero (-0.043).
Important Things to Note
- Ensure that the two ranges of data you provide are of equal length and contain numeric values.
- Consider using named ranges to make your formulas more readable and easier to understand.
- Experiment with different ranges of data to explore various correlations and gain insights.
- Additional statistical analysis tools, such as scatter plots, can be used to visualize and interpret the correlation.
- The matrix is symmetric, with the same Google Sheets correlation coefficients appearing above and below the diagonal.
Frequently Asked Questions (FAQs)
The following are some errors you get with the correlation matrix in Google Sheets.
• #VALUE!: It occurs when the ranges provided to the CORREL function are not numeric values. Always double-check if the values you provided are numeric.
• #DIV/0!: It occurs when either of the ranges of data or both contain zero values. Here, the correlation coefficient cannot be calculated as dividing by zero is undefined.
• #N/A!: This error occurs when one or both of the ranges of data contain non-numeric or missing values. Always cross check your dataset before adding the range to the CORREL function.
1. Calculating the correlation matrix in Google Sheets involves using the CORREL function with the following steps.
2. Arrange your data in a table format with rows and columns. Usually, each column represents a different variable, while the row represents a data point.
3. Use the CORREL Function to calculate the correlation coefficient between the two sets of data.
Syntax: =CORREL(range1, range2)
range1: The first variable’s range.
range2: The second variable’s range.
4. Now, set up your correlation matrix by creating a grid for the matrix.
5. Calculate the correlations for each cell of the matrix using the CORREL function
6. Finally, each correlation coefficient is entered into its corresponding cell in the matrix.
1. A correlation matrix is often used as an input for other analyses. This matrix is a valuable tool for data analysis to understand the structure and relationships within the datasets.
2. It helps us identify how different variables are related to each other, whether strong or weak.
3. Not just between two variables, a correlation matrix summarizes the correlations between all the variables in a dataset simply.
4. A high correlation between independent variables in regression analysis leads to multicollinearity, which affects the overall model’s performance. A correlation matrix helps detect and address multicollinearity.
Use this Correlation Matrix in Google Sheets Template to follow along with the examples in this article.
Download Excel TemplateRecommended Articles
Continue with these related resources when you want the next practical step in this topic.
- Descriptive Statistics in Google Sheets
- Standard Deviation in Google Sheets
- MEDIAN Google Sheets Function
- MODE Google Sheets Function
- Frequency Distribution In Google Sheets
Explore the full Google Sheets Statistical Functions guide or browse Google Sheets Resources.