
What Is COVARIANCE.P Excel Function?
The COVARIANCE.P Excel function measures how two sets of data points are linearly related. It returns population covariance, which is the average of the derivations’ products of deviations for each pair of data points in two data sets. It is useful in financial analysis and portfolio management to understand the co-movement between assets. It assumes the data represents the entire population, providing a more accurate estimate of covariance compared to COVARIANCE.S.
The example shows how to calculate the covariance of numbers in a range, given two sets of values, using the COVARIANCE.P function in Excel.

Enter the formula =COVARIANCE.P(A2:A5, B2:B5) in cell D2. You get the result as 1.125, which is the covariance.

Use this COVARIANCE.P Excel Template to follow along with the examples in this article.
Download Excel TemplateKey Takeaways
- COVARIANCE.P in Excel measures how two sets of data points move together. It is especially useful in financial analysis and portfolio management to understand how assets co-move.
- The COVARIANCE.S function is accessible in MS Excel 2010, serving as an enhanced iteration of the COVAR function found in previous Excel editions.
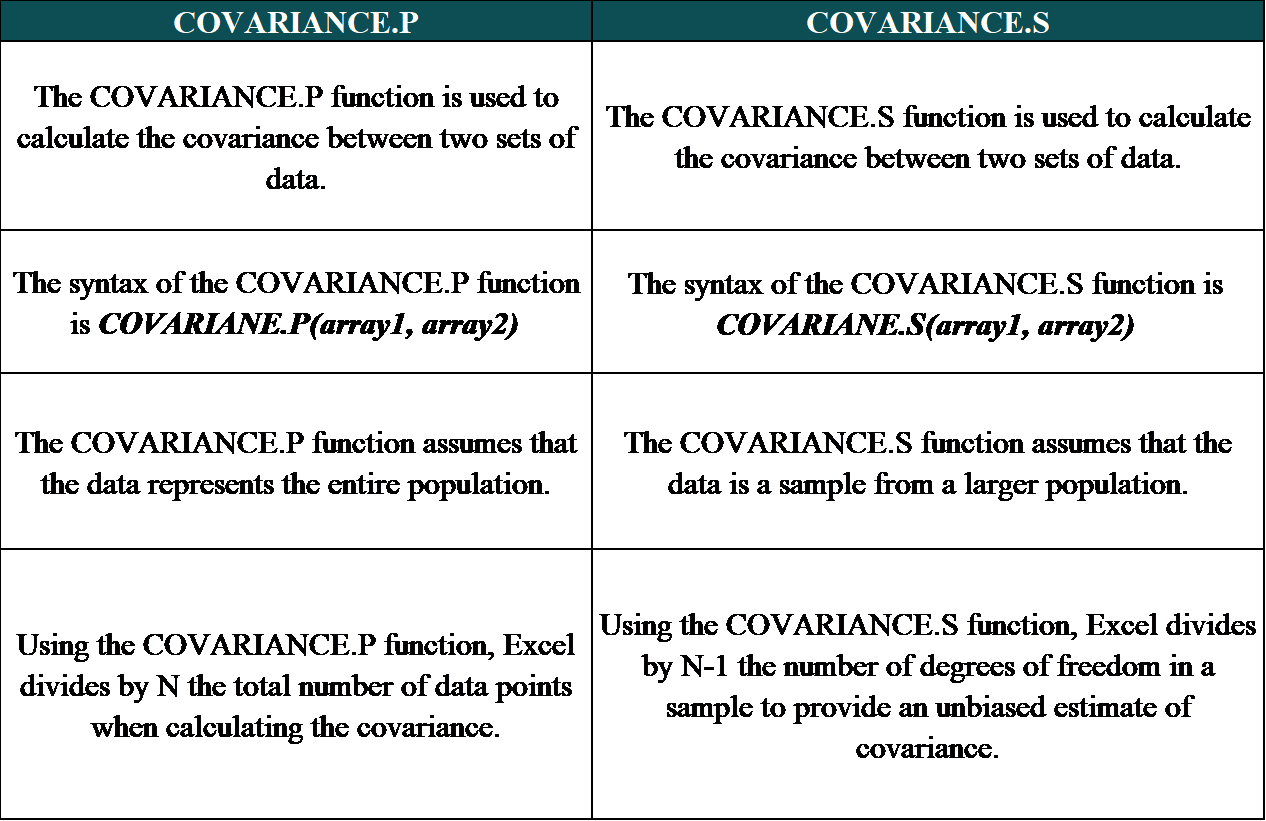
- The syntax of the COVARIANCE.P function is COVARIANE.P(array1, array2)
- By using this function, analysts can assess the degree to which changes in one variable are related to changes in another, helping them make informed decisions regarding portfolio diversification, asset allocation, and risk mitigation strategies.
- The COVARIANCE.P function is used in quantitative analysis and decision-making processes for professionals across various industries.
Syntax

- Array1 – (Mandatory) This is the first cell range of integers.
- Array2 – (Mandatory) This is the second cell range of integers.
How To Use COVARIANCE.P Function in Excel?
To effectively utilize the COVARIANCE.P function in Excel, please follow the steps outlined below.
#1 – Access from the Excel ribbon
- Select the cell in which the answer is to be displayed. Navigate to the Formulas tab and click on it.

- Select the More Functions option from the function library.

- To utilize statistical functions, first click on “Statistical” in the drop-down menu, then select “COVARIANCE.P” from the options provided.

- Input the values for the arguments in the Function Arguments window and then proceed by clicking OK to continue.


#2 – Enter the worksheet manually
Step 1: To calculate the result using Excel, start by selecting an empty cell and entering the formula =COVARIANCE.P(). Alternatively, you can start typing =C and then double-click on the COVARIANCE.P function from the Excel suggestions.

Step 2:
- Enter the values for the arguments.
- Close the braces.
- Click on the Enter key to see the results.
Examples
Let us look at an example of how to use the COVARIANCE.P function in Excel in different scenarios.
Example #1
To gain a better understanding COVARIANCE.P function, let us look at two different stocks, ABC and XYZ, and their rate of returns for ten days. Let us calculate the covariance of the stocks. Look at the values provided in the table below.

Let us proceed with the following steps:
Step 1: To calculate the co-variance, enter the formula shown below in cell E2.
= COVARIANCE.P(B2:B11,C2:C11)

Step 2: You get the population covariance value in cell E2.
When calculating the covariance of two stocks using the COVARIANCE.P Excel function, it provides valuable insights into the relationship between the two.
The covariance value indicates how the returns of one stock move in relation to the returns of another stock.
A positive covariance implies that when one stock’s return increases, and other hand, while a negative covariance suggests an inverse relationship. In the result below, we have a negative value, showing an inverse relationship between the two stocks.

Example #2
In this example, we will explore the COVARIANCE.P function using the share prices of two companies, X and Y, for 12 months. We will be calculating the covariance between the shares of these companies. Please refer to the table for the values needed for this calculation.

Look at the table above. To utilize the COVARIANCE.P Excel function, please follow the steps outlined below:
Step 1: In cell E2, enter the following formula.
= COVARIANCE.P(B2:B13,C2:C13)

Step 2: The resulting value is $7,63,173.17 is displayed in cell E2, as shown in the image below.

When comparing the share prices of two companies using the COVARIANCE.P Excel function, investors can gain valuable insights into the relationship between their returns. A positive covariance as seen above, indicates that the share prices tend to move in tandem, i.e., when the prices of company X move up, the share prices of company Y also move up.
Example #3
The below example delves into the COVARIANCE.P function by analyzing the marks of two subjects: Science and Accounts. Our goal is to calculate the covariance between these subjects for the students. The table for the values is below.

To use the COVARIANCE.P Excel function, just follow these simple steps.
Step 1: Enter the formula shown below in cell E2 and calculate the result.
= COVARIANCE.P(B2:B13,C2:C13)

Step 2: The calculated result value is displayed in cell E2, as shown in the image below.

When comparing the marks of two subjects of students using the COVARIANCE.P Excel function, one can obtain a measure of how these two variables change together. A negative covariance indicates an inverse relationship.
Important Things To Note
- The COVARIANCE.P function in Excel ignores text or logical values in arrays. It only works with numeric data in arrays of the same size, with non-empty cells and non-zero standard deviation.
- The #VALUE! error arises when either one or both provided data arrays are devoid of values.
- The #N/A error emerges when the arrays provided are of unequal lengths.
- The COVARIANCE.P function is a tool in statistical analysis, particularly in the fields of finance, economics, and risk management.
- This function allows professionals to calculate the covariance between two sets of data points, providing valuable insights into the relationship and level of co-movement between variables.
Frequently Asked Questions (FAQs)
In Excel, covariance is a statistical measure used to quantify the degree to which two random variables change together. Specifically, it measures the direction of the linear relationship between two sets of numbers. The function for Covariance in Excel is commonly used in data analysis, especially when examining the relationship between variables.
In this example, we have a turnover of Peter’s company and Albert’s company from 2010 to 2015; we are calculating the covariance using the COVARIANCE.P Excel function. Look at the table below.
Enter the COVARIANCE.P Excel formula in the cell E2 as
=COVARIANCE.P(B2:B7, C2:C7), and the result obtained is $13.83.
Enter the COVARIANCE.S Excel formula in the cell F2 as
=COVARIANCE.S(B2:B7, C2:C7), and the result obtained is $16.60.
When comparing the results of COVARIANCE.P and COVARIANCE.S in Excel, it is important to note the method of calculation utilized by each function. COVARIANCE.P calculates the covariance based on the population parameters, making it ideal for large datasets that encompass an entire population. On the other hand, COVARIANCE.S computes the covariance using sample data, which is useful when working with smaller sets of data or subsets of a population.
The limitations of using the COVARIANCE.P function are;
• It is important that the function only calculates the covariance between two sets of data and not a complete matrix like the COVAR or COVARIANCE.S functions.
• The function assumes that both sets of data are samples from a larger population rather than the entire population itself. If the data represents the entire population, consider using the COVAR function instead for a more accurate result.
• It is essential to ensure that both data sets have equal lengths and no missing values to avoid any errors in calculation.
Use this COVARIANCE.P Excel Template to follow along with the examples in this article.
Download Excel Template