
What Is EXPON.DIST Excel?
The EXPON.DIST function in Excel is a statistical function that calculates the exponential distribution of a given value based on known parameters. It is commonly used in probability theory and statistics to model events with a constant rate of occurrence over time.
The EXPON.DIST Excel function takes three arguments: x, lambda, and cumulative. The ‘x’ parameter represents the value at which you want to evaluate the exponential distribution. Lambda denotes the parameter value, which represents the average number of events occurring in one unit of time. The ‘cumulative’ argument determines whether you want to calculate the cumulative distribution function (TRUE) or the probability density function (FALSE).
Use this EXPON.DIST Excel Template to follow along with the examples in this article.
Download Excel TemplateThe following example demonstrates the effective use of the EXPON.DIST Excel.

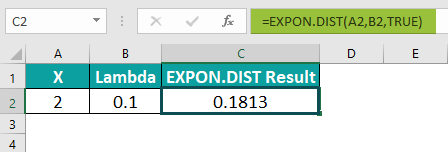
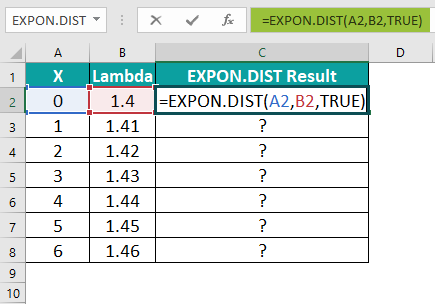
To calculate the value, we will utilize the following formula. Enter the formula in cell C2 as follows: =EXPON.DIST(A2, B2, TRUE). After entering the formula, the resulting values will be displayed in cell C2, as depicted in the image below.
Syntax
x: This is a required argument. It represents the value of the function.
Lambda: It is a required argument. The parameter value is crucial for the calculation.
Cumulative: It is a required argument. It is a Boolean value that determines the type of calculation.
TRUE: Represents the cumulative distribution function.
FALSE: Represents the probability density function.
Key Takeaways
- The EXPON.DIST’s versatile function enables professionals from diverse fields, such as finance, engineering, and science, to analyze data trends, make predictive models, and assess risks accurately.
- The EXPON.DIST Excel applicability extends beyond just Excel spreadsheets; it empowers professionals to make informed decisions by harnessing its potential for data analysis and forecasting.
- The exponential distribution is a useful tool for calculating the likelihood of reaching the first success in each number of trials within a Poisson distribution. In other words, it helps us understand the time intervals between events in a Poisson process. This distribution is similar to the geometric distribution, but it operates continuously.
How To Use EXPON.DIST Function in Excel?
To effectively utilize the EXPON.DIST function in Excel, follow these steps.
#1 – Access from the Excel ribbon
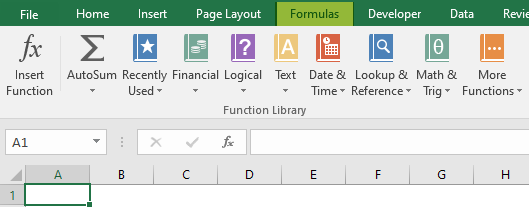
Step 1: Choose the empty cell which will contain the result. Go to the “Formulas” tab and click it.
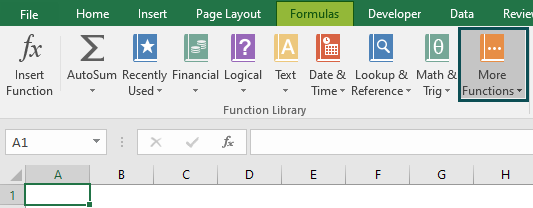
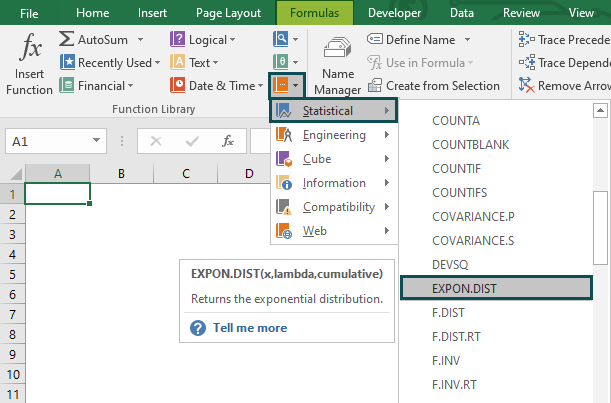
Step 2: Select the “More Functions” option from the menu.
Step 3: Select the “Statistical” option from the drop-down list. Select “EXPON.DIST” from the drop-down menu.
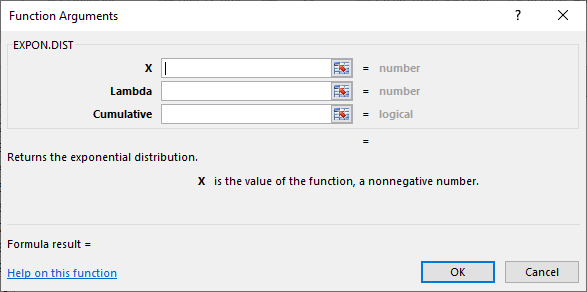
Step 4: A window called “Function Arguments” appears. As the number of arguments, enter the value in the “probability,” “mean” and “standard_dev.” Select OK.
#2 – Enter the worksheet manually
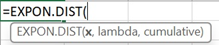
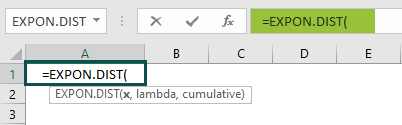
Step 1: Select an empty cell for the output. Type “=EXPON.DIST()” in the selected cell. Alternatively, type “=E” and double-click the EXPON.DIST function from the list of suggestions shown by Excel.
Step 2: Press the “Enter” key to get the result.
Examples
Example #1
To gain a comprehensive understanding and effectively apply the EXPON.DIST Excel function, let us delve into the following example. The data in the provided table is organized as follows:
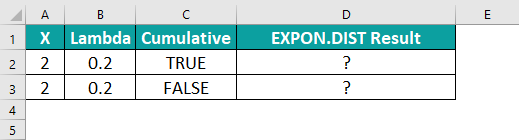
To calculate the desired output in cell D2, please adhere to the following steps.
Step 1: Begin by selecting the cell where the formula will be entered. For this demonstration, let us choose cell D2. Proceed to enter the formula. The complete formula to be entered in cell D2 is as follows:
=EXPON.DIST(A2, B2, TRUE).
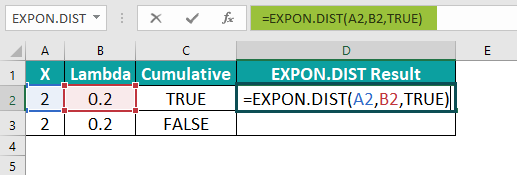
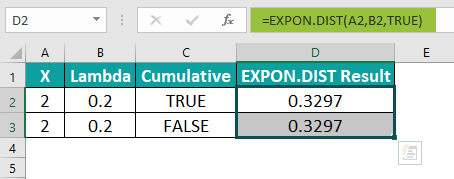
Step 2: Once each value has been entered in the previous step, press the Enter key. The resulting value will then be displayed in cells D2 to D3, as exemplified in the provided image.
Example #2 – Calculating the Probability Density Function
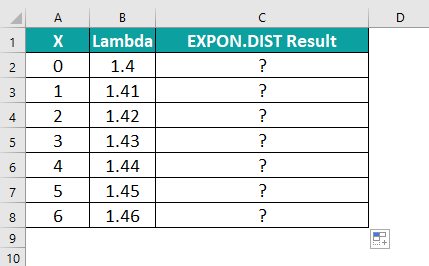
To gain an understanding of the function, we will effectively apply the EXPON.DIST Excel function to calculate the probability density function. The data in the given table is structured as follows:
- Column A represents the X.
- Column B represents the Lambda.
- Column C represents the EXPON.DIST Excel result.

Step 1: Let’s calculate the probability density value using the formula, keeping the x value increased by 2 and the cumulative value as false.
Step 2: The formula entered in cell C2 is as follows:
=EXPON.DIST(A2,B2,FALSE).
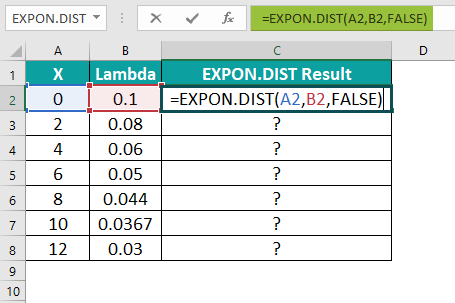
Step 3: After entering the value, the result is shown in the following image in cells C2 to C8; we can proceed with the analysis.

Example #3 – Calculating the Cumulative Distribution Function
In the following example, we calculate the cumulative distribution function using the EXPON.DIST Excel function.
The data in the table is organized like this:
• Column A represents the X values.
• Column B represents the Lambda values.
• Column C represents the EXPON.DIST results.
Step 1: Let’s calculate the cumulative distribution value using the formula, where we’ll increase the x value by 1, starting with 0, lambda as random values, and keep the cumulative value as true, so that it returns the cumulative distribution function.
Step 2: The formula we’ll enter in cell C2 is as follows:
=EXPON.DIST(A2,B2,TRUE).
Step 3: Once we’ve entered the formula, press Enter. You get the result in cell C2. Using the Autofill handle, drag the formula all the way down to cell C8.

Important Things To Note
- The #NUM! error occurs when the value of x provided is negative or when the supplied lambda is less than or equal to zero.
- The #VALUE! error occurs when any of the arguments provided are non-numeric.
- The EXPON.DIST Excel function plays a crucial role in statistical analysis, making it an indispensable tool in various professional fields. This function allows for the calculation of probabilities and cumulative probabilities associated with exponential distributions, enabling practitioners to model and analyze real-world phenomena characterized by constant hazard rates.
- By understanding the probability density of random variables that exhibit exponential behavior, professionals can make informed decisions about reliability, project scheduling, financial forecasting, and risk management using EXPON.DIST Excel function.
Frequently Asked Questions (FAQs)
The EXPON.DIST function is a mathematical statistical function in Excel that is used to calculate the exponential distribution for a given set of parameters. This distribution represents the probability of a certain event occurring over time, assuming that the events occur independently and at a constant rate.
The EXPON.DIST Excel function not only enhances decision-making processes by offering valuable insights into probabilities but also eases data interpretation by providing efficient calculations within Excel.
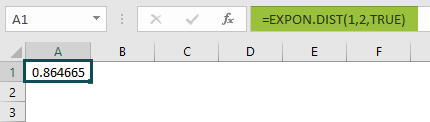
For example, the image below demonstrates the effective use of the EXPON.DIST Excel function.
The formula we will enter in cell C2 is: =EXPON.DIST(A2, B2, TRUE). The result is as shown in the image below.
The EXPON.The DIST function in Excel has certain limitations and constraints that need to be considered.
• Firstly, the function assumes that the rate parameter (lambda) is known and supplied as an input. However, in real-world scenarios, this parameter is often estimated from available data, which could introduce potential inaccuracies.
• The EXCEL.DIST function assumes that the probability density function has a continuous distribution. This means that it may not be suitable for discrete data sets with limited or specific values.
• Furthermore, it is worth noting that any extreme outliers or data points beyond the range specified in the function will not be considered when calculating probabilities.
The EXPON.DIST and NORM.DIST functions in Excel are statistical functions that serve different purposes.
• The EXPON.DIST Excel function calculates the probability of an event occurring at a specific time in an exponential distribution, which is commonly used to model events that have a constant hazard rate, such as machine failures.
• On the other hand, the NORM.DIST function calculates the probability of a value falling within a specified range in a normal distribution, also known as Gaussian distribution. This distribution is widely used to model real-world phenomena like heights or IQ scores.
While both functions use different mathematical formulas and assumptions about the underlying data, they provide valuable insights into different types of probability distributions.
Use this EXPON.DIST Excel Template to follow along with the examples in this article.
Download Excel Template