
What is Exponential Smoothing in Excel?
Exponential smoothing is used for time series forecasting and helps smooth out irregularities to recognize trends easily. This smoothening of time-series data is helpful for short-term forecasting. Exponential smoothing works on the principle of weighted average. It means that the values closer to the forecast value are given more significant weightage than older or more distant values.
Let us look at an example where we have applied exponential smoothing. Here, we have data for January to June. Here, Column B contains the period, while Column C contains the actual values. Go to the following path: Data Tab → Analysis group → Data Analysis. Choose Exponential Smoothing in the “Data Analysis” popup window. We have given the input range (C2:C7), the output range (E2), and the Damping Factor as 0.9. After checking the Chart Output box, press OK. Here, the last smoothed value is given a large weight of 0.9 and we get the curve as shown in orange.
Use this Exponential Smoothing in Excel Template to follow along with the examples in this article.
Download Excel Template
Key Takeaways
- Exponential Smoothing in Excel forecasts business data for taking appropriate decisions. It is of three types: Single, Double, and Triple Exponential smoothing. The smoothed value for the first data point is not calculated because there is no previous data point.
- It is used to smooth out data for short-term forecasts. This can be done by adjusting the damping factor to a value between zero and one.
- This forecasting method is ideal for non-linear data models with seasonal or recurring patterns.
Explanation of Exponential Smoothing
We consider any time series data to have random “noise,” containing peaks and valleys, as seen in the chart above. However, exponential smoothing allows you to smooth out these fluctuations, thereby helping in reliable forecasting. Additionally, we have an in-built option for Exponential Smoothing in Excel, saving time from tedious calculations.
Some essential factors in Exponential Smoothing in Excel include:
- Alpha α – Smoothing factor for the level. The smaller this value, the more the curve is smoothed out. It controls the rate of influence of the exponential decrease in past observations.
- Damping Factor – It is equal to 1 – α.
In the above example, we have the value of the damping factor as 0.9. Therefore, the alpha value is 0.1 as the damping factor is 1 – α. So, the forecast for the time series data is almost smooth.
The method works by giving larger weights to recent observations and exponentially decreasing weights as the observations become increasingly distant.
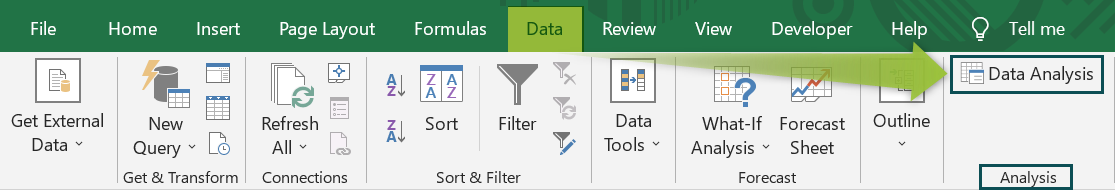
Where to Find Exponential Smoothing in Excel?
First, ensure that the Data Analysis Tool is added to Excel. If you do not find the Analysis group under the Data tab, go to File → Options.

- Here, in the popup window, click on Add-Ins in excel, then choose “Analysis Toolpak.”
- Click on “Go.”

Check the box for Analysis Toolpak and click OK.

The “Data Analysis” option is now under the “Data” tab.

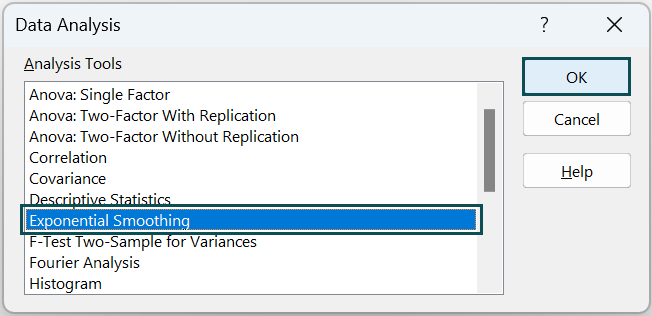
When you click “Data Analysis,” you can see many statistical techniques. Now, choose “Exponential Smoothing” from here.

Types of Exponential Smoothing
There are three types of Exponential Smoothing in Excel.
- Simple or Single Exponential Smoothing: This is used for univariate data without trend or seasonality. It contains a single parameter, alpha.
- Double Exponential Smoothing: Here, in addition to alpha, we have an additional smoothing controlling the decay of the influence of the trend changes called beta. It has no trend but a seasonal pattern.
- Triple Exponential Smoothing: This type of advanced exponential smoothing in Excel is used when the data has linear trends and seasonal patterns.
How to Do Exponential Smoothing in Excel?
Let us look at an example of calculating exponential smoothing in Excel using time series data. It helps us recognize trends by smoothing out the curves.
The table below contains the time series.

Below are the steps to do Exponential smoothing in excel –
- To forecast the trend by applying exponential smoothing, go to the Data tab, and in the Analysis group, choose Data Analysis.

- Now, select Exponential Smoothing.

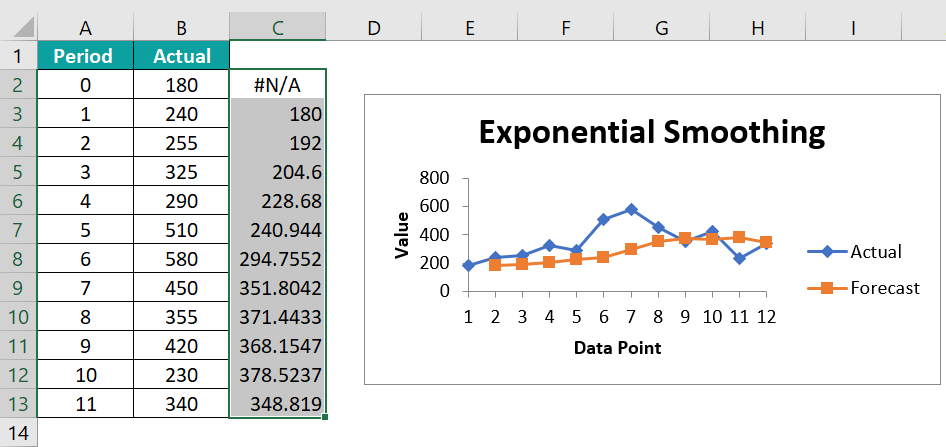
- • Choose the Input Range by clicking on it in the Excel sheet. Here, we choose B2:B13.
• In the Damping factor box, type 0.8.
• Click in the Output Range box and select C2. Check the box for Chart Output and press OK.


Examples
Let us look at some examples where we apply exponential smoothing in several scenarios and analyze the outcome.
Example #1 – Sales Forecast
Below is a table containing the sales details of a small business over 12 months. The first column contains the time in months, while the second column shows the sales in dollars. Given the sales data, using a quantitative method like a moving average in excel or smoothing technique gives you good results for the sales forecast.
We know that sales are often affected by trends and seasonal patterns. Like for instance, sales spike around Christmas time. Hence, we should also realize that such trends also come to an end once the season is over and take them into account.

- Step 1: Click the Data tab and select the Data Analysis tab.

- Step 2: If you don’t have the data analysis enabled, go to the following location and install it, as shown earlier.
File → Options →Add-Ins → Excel Add-ins → Analysis ToolPak
Now, the data analysis tab takes you to a box of different formulas. Click on Exponential Smoothing. Then, fill in the following details.

- Here, the input range is the sales figures, so select cells B2 to B13.
- Next, add the “damping factor”. Enter a value in the range 0-1.
- If the company experiences unpredictable spikes in sales, choose a steadier exponential smoothing. A number between 0 – 0.6 is ideal.
- For a company with an exceptional increase in sales, the most recent periods are important, so set the damping factor between 0.7 – 1. Here, we choose 0.9.
- Finally, select where the exponential smoothing results should go. Here, we chose cell C2.
- Step 3: As observed, the exponential smoothing forecast appears in column C along with a line graph in excel.

- Step 4: The forecast for extended months can be calculated by clicking and dragging the bottom-right corner of the value forecast for December. Thus, where we drag, the cells further down will automatically fill with the projected forecast.

Example #2 – Forecast Trend for Different Damping Factors
In this example, we will use simple exponential smoothing to check the demand for a product. We can check the resulting values and graph for different values of alpha. Here, we will use an alpha of 0.7 first and 0.2 in the lower chart.

- Step 1: Click the Data tab and select the Data Analysis tab.

- Step 2: The data analysis tab takes you to a box of different formulas. Click on Exponential Smoothing in Excel. Then, fill in the following details.

- The input range is the demand, so select cells B2 to B13.
- Next, add the “damping factor.” Enter a value in the range 0-1. To get an alpha value of 0.7, we add 0.3 as the damping factor = 1 – α.
- Finally, select where the exponential smoothing in Excel results should go. Here, we selected cell C2.
- Step 3: We must adjust the y-axis for a clearer idea in the resultant graph. Click on the y-axis and observe the Format axis pane on the right side.
Adjust the minimum value to 400.

- Step 4: Press OK. You can observe that the time series plot with 0.7 alpha (orange line) is jagged and adjusts to changing conditions more rapidly. More weight is placed on recent observations here.

- Step 5: Now, let us plot the forecast for the same with alpha at 0.2. Go to the Data Analysis tab in the Data tab and choose Exponential Smoothing upon clicking it. Then, change the damping factor to 0.8 since we need alpha at 0.2.

- Step 6: Press Ok, Like the previous graph, adjust the y-axis with a minimum value of 400 in the Format Axis pane.

- Step 7: Press Ok and observe the change in the graph.

As observed, when alpha is 0.7, it is rapidly adjusted to the changing conditions and proves a better fit here compared to when alpha is 0.2.
Example #3
Using exponential smoothing in Excel for different alpha values, let us try to add all the graphs in a single chart. Let us take the value of α as 0.2, 0.7 and add a new value, 0.9. Now, we already have the graphs for the first two values. Let us get the graph for alpha = 0.9.
- Step 1: Enter the details under the following:
Data tab → Data Analysis → Exponential Smoothing

Here, the damping factor is 0.1, and we obtain the output range under E2.
- Step 2: The resultant chart is as follows.

- Step 3: Select the three columns with forecast details for different alpha values, 0.2, 0.7, and 0.9.

- Step 4: Go to Insert → Chart → Insert Line or Area Chart → Line Chart.

- Step 5: The resultant graph is as follows.

- Explanation
- As the value of alpha decreases, the curve becomes smooth.
- For an alpha value of 0.9, the curve adjusts more to the changes in data.
Important Things to Note
- The higher the alpha value, the more volatility of the forecast data.
- The alpha value will be between 0-1.
- We can see more fluctuations in the data points as the alpha value increases.
- Ideal damping values are 0.2 or 0.3 for unpredictable spikes in data values.
Frequently Asked Questions (FAQs)
Exponential smoothing in Excel is used to smooth out the data series curve to obtain accurate and reliable short-term forecasts. It works by giving more weightage to recent data and exponentially decreasing the weightage of data from the nearest to the farthest.
Double Exponential smoothing can be applied in Excel using the Holt-Winters exponential smoothing in Excel. For this, you should assign random alpha, beta, and gamma values, calculate the seasonal index, and use the following formula:
ŷi+1 = ui + yi
Sometimes, the Data Analysis group will not be visible in Excel, and you may be unable to apply Exponential Smoothing. In such cases, go to the path, File → Options → Add-Ins → Excel Add-ins → Analysis ToolPak and add the Data Analysis tool. It’s immediately visible under the Data tab.
Use this Exponential Smoothing in Excel Template to follow along with the examples in this article.
Download Excel Template