
What Is FORECAST Function In Excel?
The FORECAST function in Excel is an inbuilt Statistical function that predicts a future value based on existing values. It does the future value predictions using linear regression, and users can use it to calculate future sales and consumer requirements.
The FORECAST.LINEAR() replaced the FORECAST Excel function in Excel 2016. Thus the FORECAST() is now available for backward compatibility. For example, a company consolidates sales data on the 25th of every month. The below table shows the sales data for 2021, and now, we need to predict the sales for the first six months of 2022.
Use this FORECAST Excel Function Template to follow along with the examples in this article.
Download Excel Template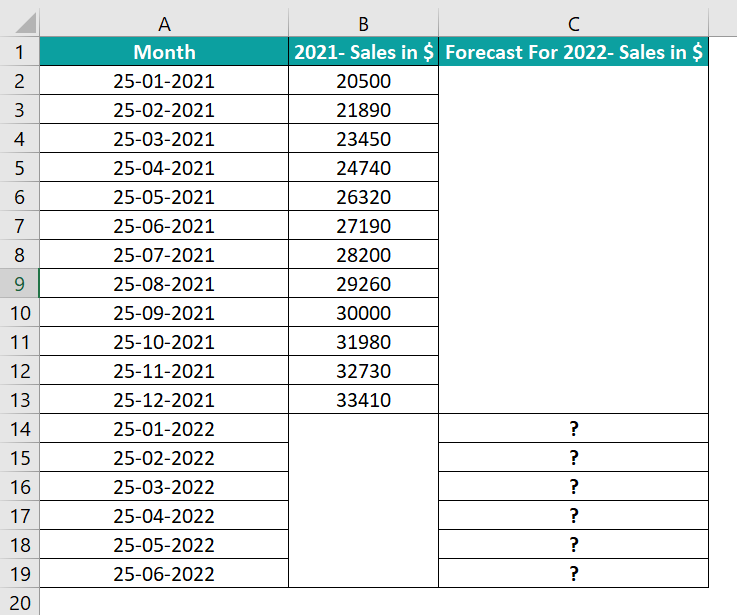
Using the FORECAST function, we can populate the required data in the target cell range C14:C19 based on the existing 2021 sales data. Also, we can graphically analyze the trend as depicted in the below image.
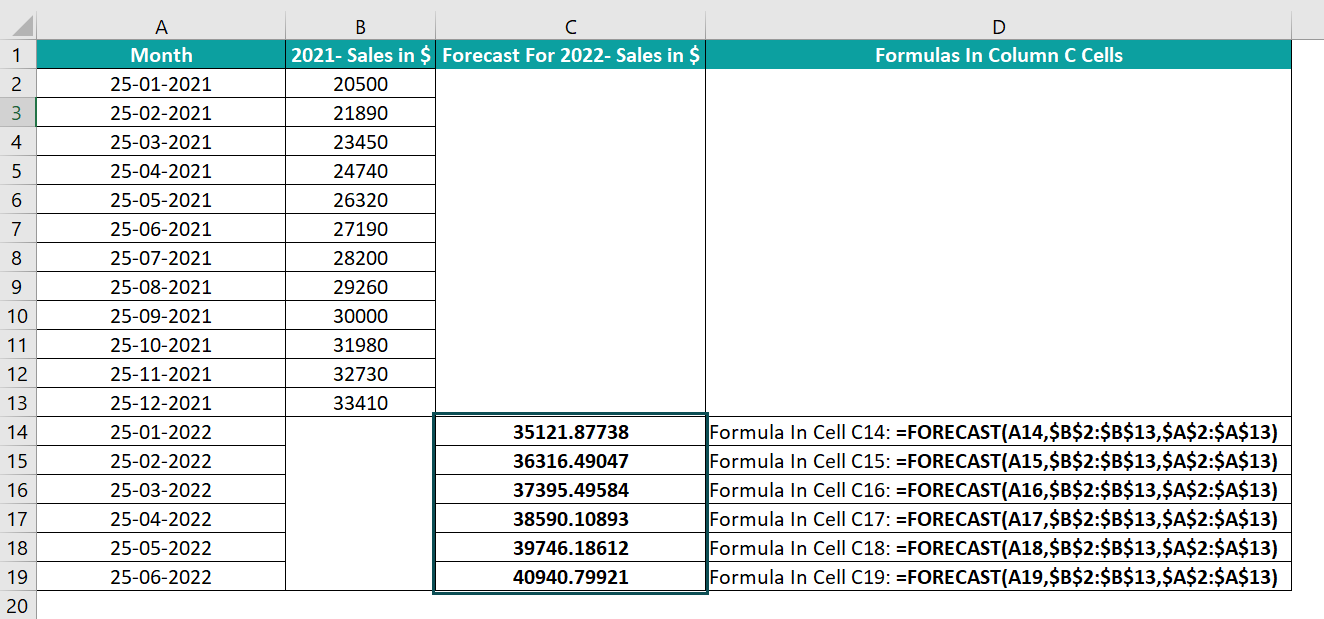
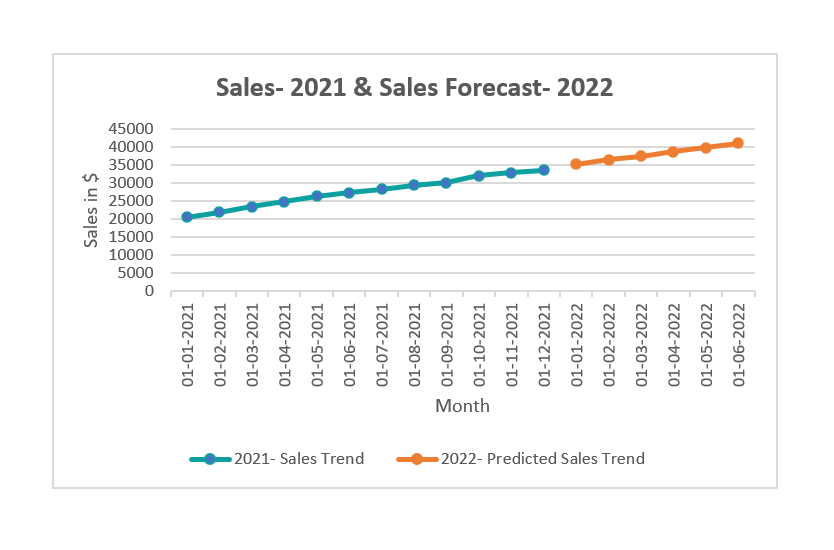
In the above FORECAST Excel function example, we can observe that based on the 2021 sales data, the predicted 2022 sales figures show an upward trend.
The next section will explain the FORECAST function arguments we must supply to achieve the required forecast results.
Key Takeaways
- The FORECAST Excel function forecasts a future value using the existing data based on the linear regression concept.
- The FORECAST() takes three mandatory arguments as inputs, x, known_xs, and known_ys. Then, we will forecast the new y-value for x, given the known x- and y-values.
- A newer Excel forecasting function, FORECAST.LINEAR() replaced the FORECAST() in the Excel version 2016. It also takes the above mentioned arguments, x, known_ys, and known_ys, as input.
- Users can use the FORECAST() to predict monthly and yearly future sales figures and inventory requirements.
FORECAST() Excel Formula
The FORECAST Excel Formula Syntax is:

where,
- x: a numeric x-value we need to forecast or predict the y-value for using the FORECAST().
- known_ys: The dependent data range.
- known_xs: The known independent data range.
All the above FORECAST formula arguments are mandatory. In addition, the FORECAST.LINEAR() also takes these three arguments as input.
Below are the critical points to consider while using the FORECAST Excel function.
- If the argument x is not numeric, the FORECAST() output will be the #VALUE! error.
- If known_ys or known_xs is blank or the sizes of the two data ranges differ, the FORECAST return value will be the #N/A error.
- If the argument known_xs’s variance is zero, the function output will be the #DIV/0! error.
Please Note: The above error conditions hold for the FORECAST.LINEAR() as well.
How To Use FORECAST Excel Function?
The steps to use FORECAST Excel function are:
- First, ensure our existing data required for forecasting is complete and accurate. Also, to ensure the x-value, we have to predict the y-value for is numeric.
- Next, select the target cell, enter the FORECAST Excel function, and then, press Enter.
The illustration below will explain the FORECAST Excel function and the above steps.
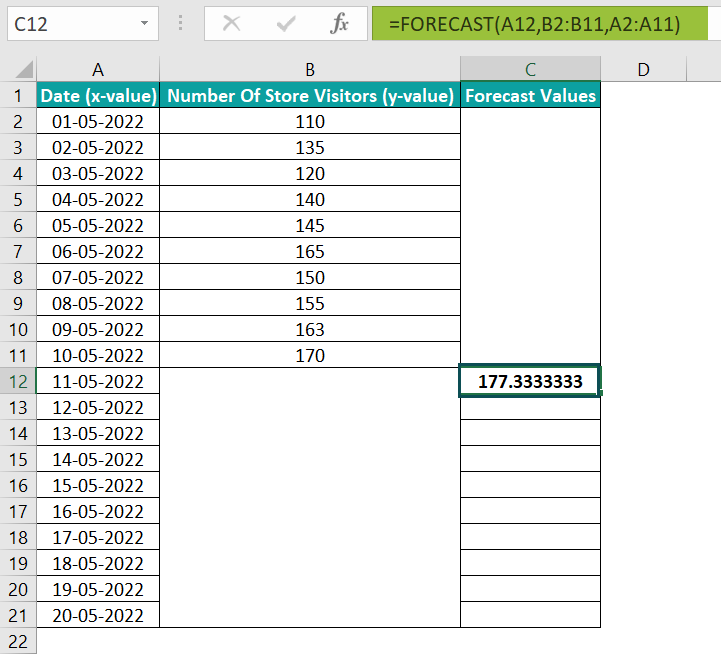
Consider the below table. It shows the number of visitors to a store during the first ten days of May.

Suppose we have to forecast the count of visitors from 11th– 20th May, based on the existing values (1st– 10th May data) and populate the predicted values in the cells C12:C21.
Then, we can use the FORECAST(), and the steps are:
- To begin with, select cell C12, enter the below FORCAST() formula, and then, press Enter.
=FORECAST(A12,$B$2:$B$11,$A$2:$A$11)
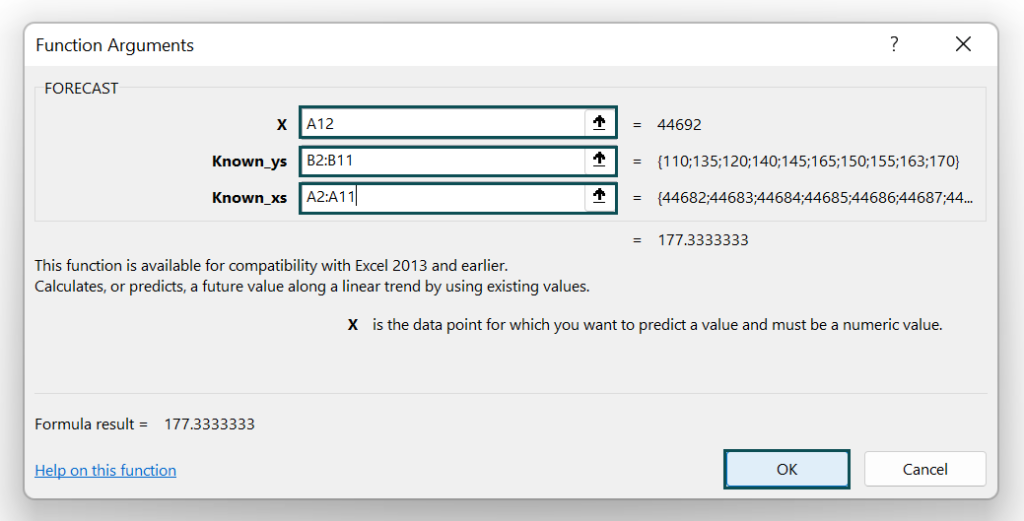
Here, argument x is the date 5/11/2022; we need to forecast the count of visitors for it. The known y-value range is the number of store visitors from 1st to 10th May, and the known x-value range is the date range 1st-10th May. With these arguments as the input, the FORECAST Excel function return value in the target cell C12 is the predicted value of 177.333.
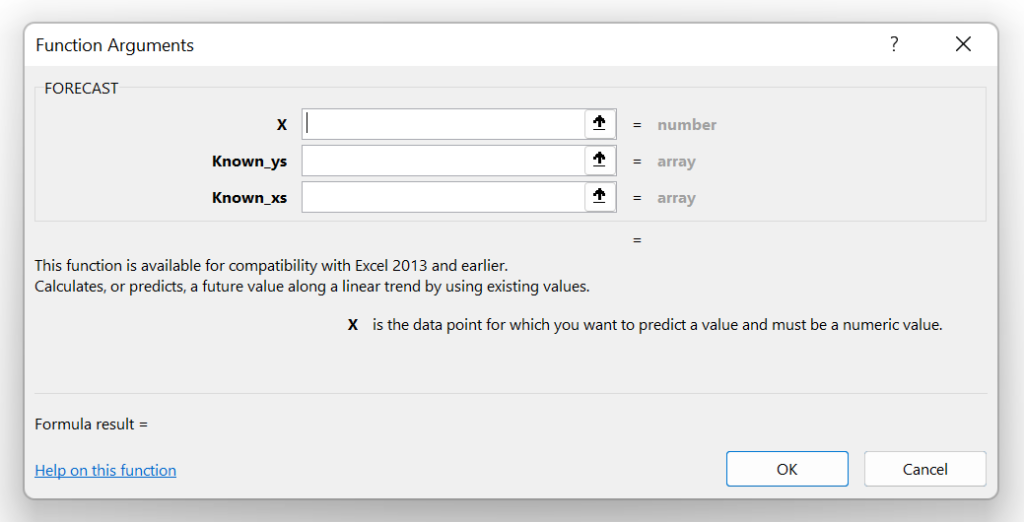
Alternatively, we can select cell C12 and then, click Formulas → More Functions → Compatibility → FORECAST to open the Function Arguments window.

Next, enter the required argument values in the Function Arguments window.
Once we click OK, we will see the FORECAST() output in cell C12. - Then, drag the fill handle downwards to copy the formula in cell range C13:C21.

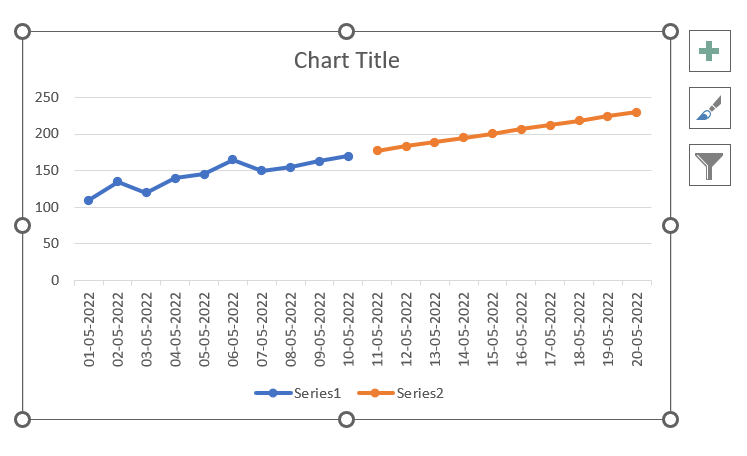
Please Note: In the above FORECAST Excel function example, the argument x (in cells A12:A21)is a date, a numeric value. If it was a non-numeric value, say May 11, the function will throw the #VALUE! error. - Then, select the cell range A2:C21 and click Insert → Line or Area Chart → 2-D Line with Markers.

Once we click on the required chart type, the below plot will appear as shown in the below image.
- Next, click on the chart area to enable the Chart Elements option. Then check the Axis Titles box to name the axes.


- Then, click on the Chart Title section to update it.

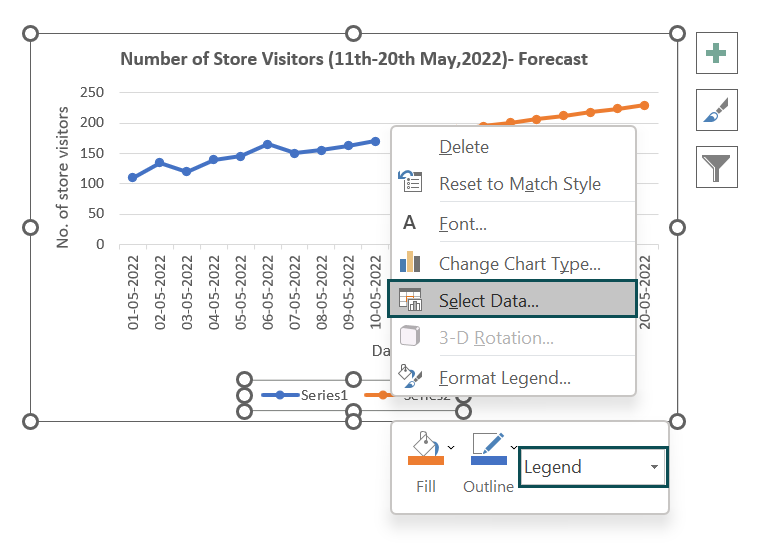
- Now, right-click on the Legend to select the Select Data option from the context menu.


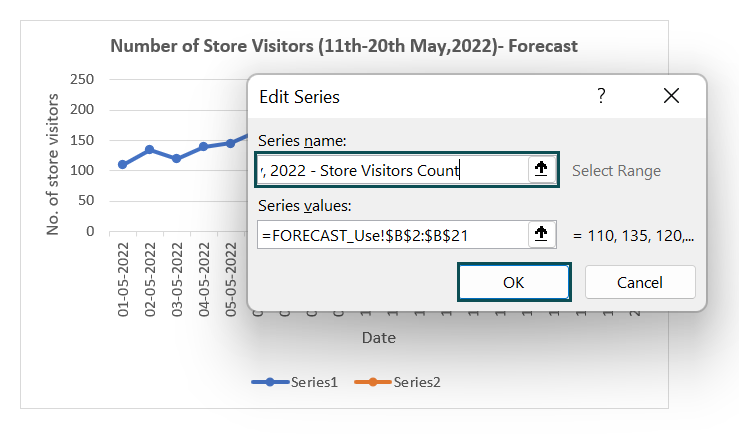
In the Edit Series window, update the Series name field with the required name and then, click OK.
Likewise, after we update the Series2 name, click OK in the Select Data Source window.
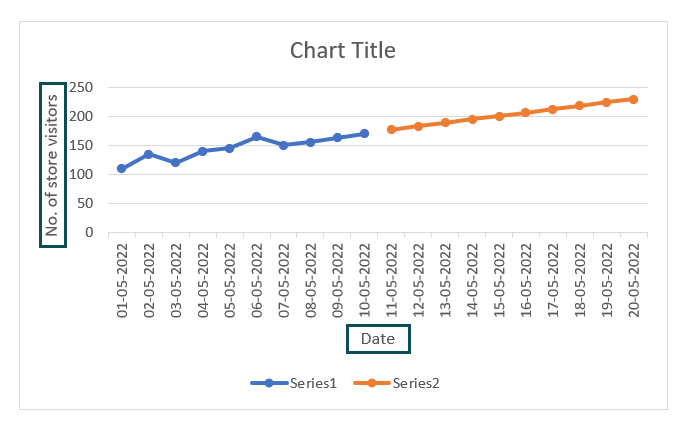
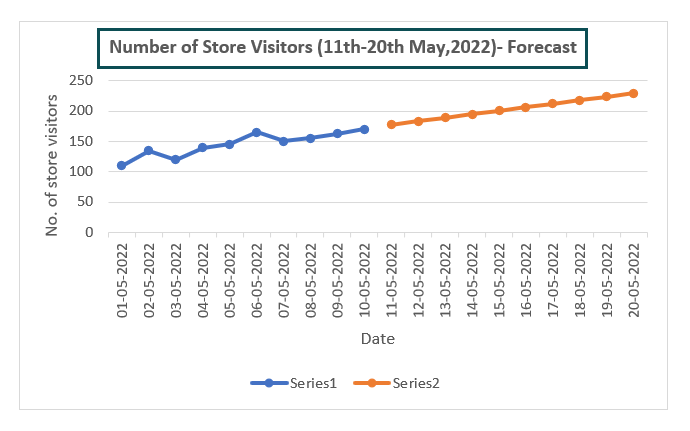
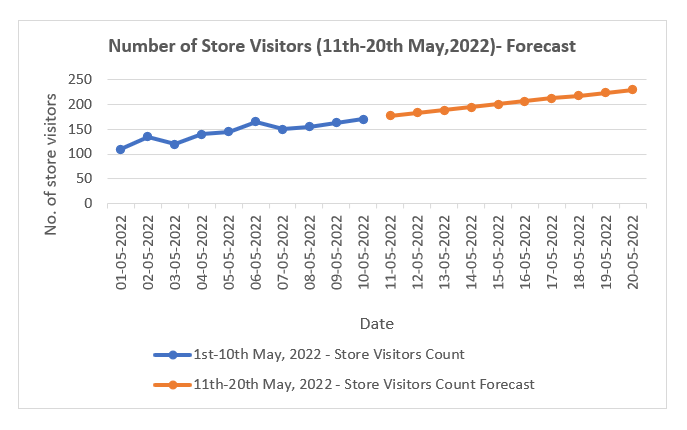
Once we click OK, the chart will appear as shown in the below image.
The graph will give us a better perspective of the forecasted values for 11th-20th May 2022, with which we can make other decisions.


Examples
Below are a few more examples to understand the FORECAST Excel function effectively.
Example #1
The mathematical equation to represent the FORECAST Excel function is:
y = a + bx
where,
- y : The new y-value we need to determine as the forecast for the x-value.
- a = ymean – bxmean
- b = ∑(x – xmean)(y – ymean) / ∑(x – xmean)2
- xmean and ymean : The mean values of the known x and y-value ranges.
Let us consider the below table containing known x- and y-values. And suppose we have to find out the forecast for a value, 28, based on the existing value.
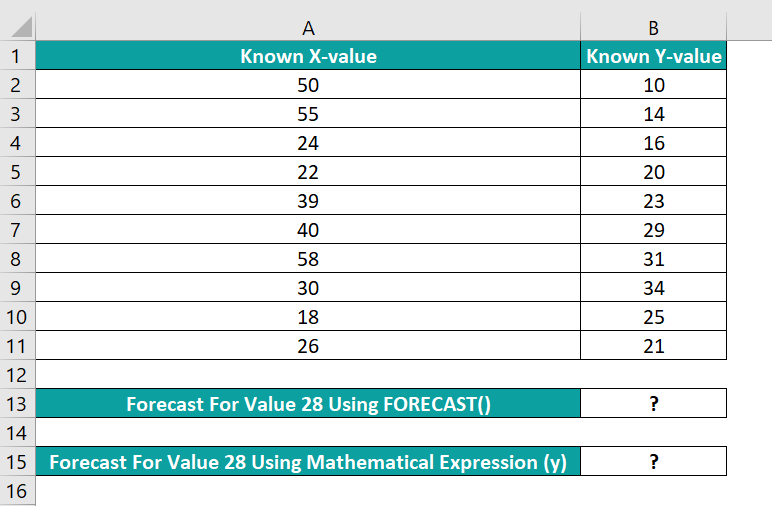
We shall first apply the FORECAST Excel function. And then, using the corresponding mathematical expression, we shall understand how it works.
Step 1: First, select cell B13, enter the FORECAST(), and then, press Enter.
=FORECAST(28,B2:B11,A2:A11)

Here the FORECAST function directly takes the value 28 as the argument x. And based on the known x- and y-values in cell ranges A2:A11 and B2:B11, the function evaluates the forecast for 28 as 22.772.

Step 2: We shall now evaluate the mathematical expression for the FORECAST(). But first, let us add a few rows and columns to the existing table required for the calculations.
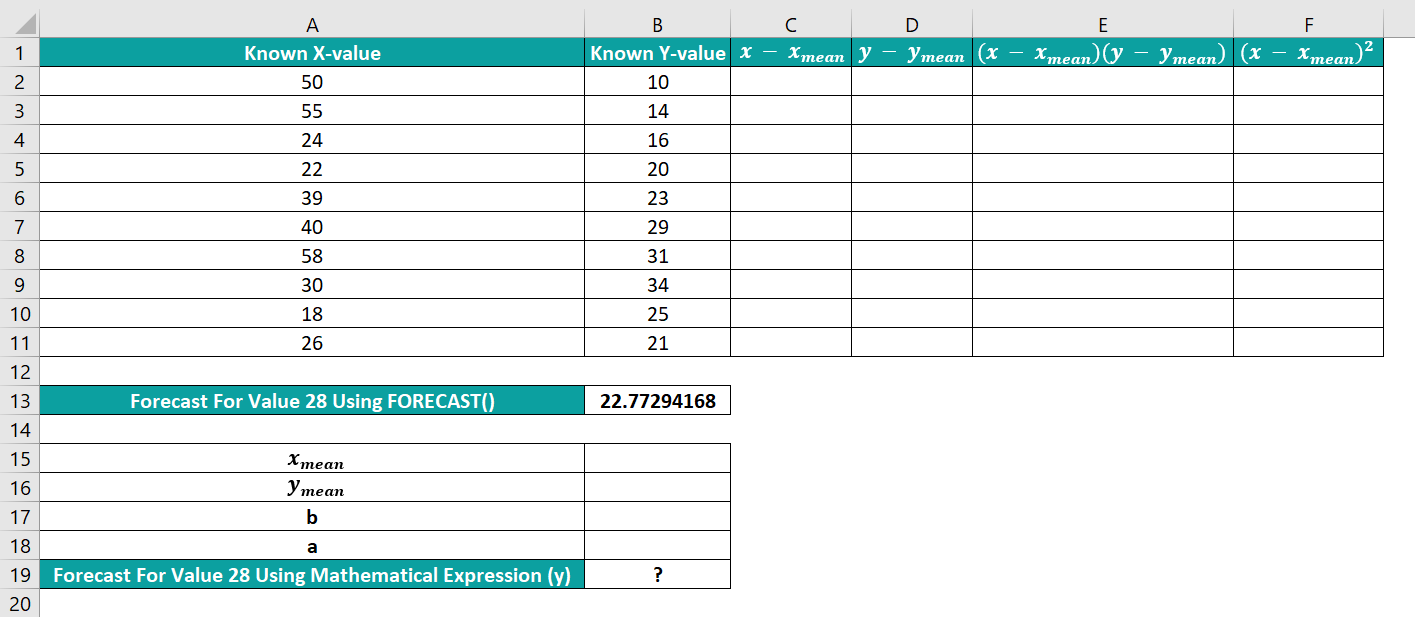
Step 3: Next, select cell B15 and calculate the mean value of the known x-values, as depicted in the below image.

Step 4: Then, select cell B16 and calculate the mean value of the known y-values, as depicted in the below image.

Now, we need to determine the b value.
Step 5: Now, select cell C2, apply the formula to determine the difference between cells A2 and B15 values, and press Enter key. Then using the fill handle, copy the formula in cells C3:C11.

Step 6: Next, select cell D2, apply the formula to determine the difference between cells B2 and B16 values, and press Enter. Then, using the fill handle, copy the formula in the cell range D3:D11.

Step 7: Similarly, select cell E2, enter the formula to multiply the values in cells C2 and D2, and press Enter. Then using the fill handle, copy the formula in cells E3:E11.

Step 8: Then, select cell F2, enter the formula to determine the square of the value in cell C2, and press Enter. Then using the fill handle, copy the formula in cells F3:F11.

Step 9: Now, we should select cell B17, enter the formula to evaluate the mathematical expression of the b value, and press Enter.

Step 10: Likewise, select cell B18, enter the formula to evaluate the mathematical expression for the value a, and press Enter.

Step 11: Next, select cell B19, enter the formula for the mathematical equation to determine the new y-value, and press Enter.

Please Note: The mathematical formula explained above also applies to the FORECAST.LINEAR().
Example #2
This example shows how to apply FORECAST.LINEAR(), introduced as a part of the new forecasting Excel functions.
Consider the below yearly income-expenditure table.

Suppose we have new data added to the above table for 2022, showing the income value. And we have to forecast the expenditure in 2022.

Step 1: To begin with, select cell C7. Enter the FORECAST.LINEAR() and press Enter.


Step 2: Alternatively, we can select cell C7 and click Formulas → More Functions → Statistical → FORECAST.LINEAR to enter the function using the Function Arguments window.

In this example, the income values from cells B2:B6 and the expenditure values from cells C2:C6 are the known x- and y-values. And the cell B7 value is the x argument; we need to determine its forecast value. Finally, using these values, we can calculate the forecast value, y, in the target cell C7.

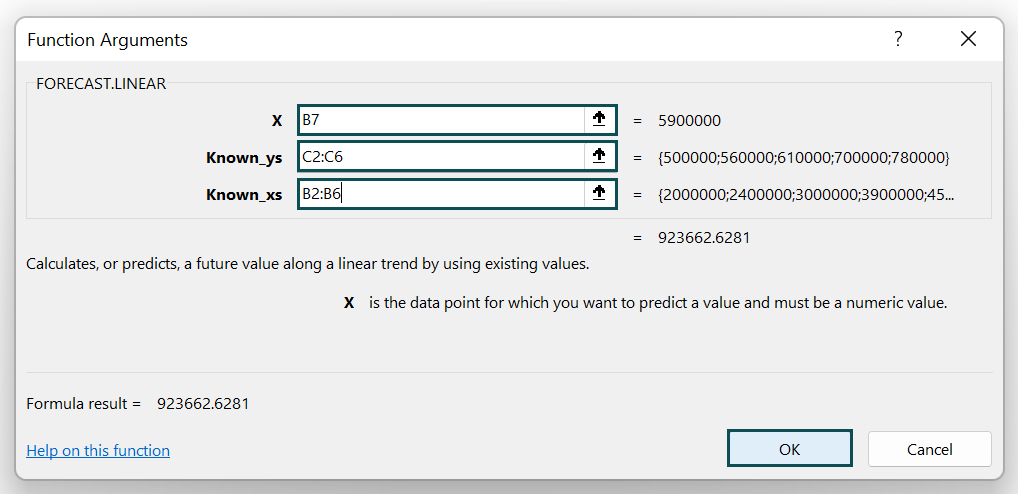
The FORECAST Excel Function will also return the same value as the FORECAST.LINEAR().
Important Things To Note
- The FORECAST Excel function currently has backward compatibility. So, we can use the newer FORECAST.LINEAR() to achieve the same forecast result as the FORECAST().
- For a non-numeric argument x, the FORECAST() output will be the #VALUE! error.
- The arguments known_ys or known_xs should not be blank, and the sizes of the two data ranges must not differ. Otherwise, the FORECAST Excel functionoutputwill be the #N/A error.
- Ensure the argument known_xs’s variance is not zero. Else the function will throw the #DIV/0! error.
Frequently Asked Questions (FAQs)
The FORECAST function in Excel is in the Formulas tab. We can click Formulas → More Functions → Compatibility → FORECAST.
The FORECAST.LINEAR() replaced the FORECAST() in Excel version 2016. So the FORECAST() is in the Compatibility functions group for backward compatibility.
We can click on Formulas → More Functions → Statistical → FORECAST.LINEAR to enter the FORECAST.LINEAR(). And it is best to use the newer forecasting Excel function, though it works exactly like the FORECAST().
We can apply the FORECAST Excel function using VBA in the following way.
The WorksheetFunction.Forecast method got deprecated in Excel version 2016 and above. Thus, it would help if we use the below FORECAST.LINEAR() code in our VBA macro to achieve the required results.
Dim instance As WorksheetFunction
Dim x As Double
Dim y_s As Object
Dim x_s As Object
Dim returnValue As Double
returnValue = instance.Forecast_Linear(x, y_s, x_s)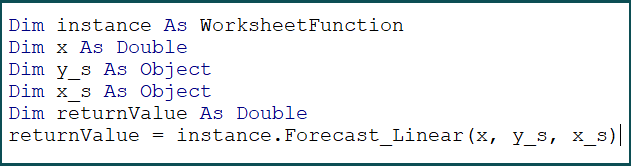
We can use FORECAST function in Excel to predict future sales figures, inventory requirements, exam scores, expenditures, and measurements.
Use this FORECAST Excel Function Template to follow along with the examples in this article.
Download Excel Template