What is Tableau Fixed Function?
The Tableau Fixed Function allows you to compute values at a fixed level of detail (LOD) using the specified input dimensions. When you specify a fixed function using the fixed level of detail (LOD), the values are aggregated based on the input dimensions level only, regardless of the dimensions specified at the view level of detail. The Tableau fixed function doesn’t consider or reference the view level of detail for data aggregation. It always takes into account what’s specified in a fixed level of detail.
For example, Suppose you have created a Data visualization view displaying the total revenue at Product Type and Customer Level in the view, but. In that case, if you want the revenue to be aggregated only at the Product Type level, you can use the Tableau Fixed function to define the aggregation.
You can apply the Tableau fixed function in different Tableau ecosystems involving Tableau Cloud, Tableau Desktop, Tableau Public, and Tableau Server. It is extremely useful when you want to view the aggregated values at a fixed LOD while maintaining a multiple dimensions view. Let us look at the syntax of Tableau Fixed functions.
Table of contents
Key Takeaways
- The Tableau Fixed Function allows you to compute values at a fixed level of detail (LOD) using the specified input dimensions without reference to the dimensions included in the view level of details.
- You can apply the Tableau fixed function in different Tableau ecosystems involving Tableau Cloud, Tableau Desktop, Tableau Public, and Tableau Server.
- You can specify the Tableau fixed function using the quick Tableau fixed LOD expression or create the LOD expression in Tableau.
- You can combine the FIXED function with other Tableau functions or calculations for creating reports or dashboards.
Syntax
To use the Tableau Fixed function, follow the syntax highlighted below:
{[FIXED] < dimension declaration > : < aggregate expression >}
The entire level of expression must be specified inside the curly braces.
For example: { FIXED [Product Type] : SUM([Revenue]) }
It accepts below parameters that include:
| Parameter Name | Description |
|---|---|
| FIXED | The keyword to determine the scoping for Tableau fixed LOD |
| < dimension declaration > | It refers to the specified dimensions, such as Region, Product Category, Customer Type, etc., that set the scope of the aggregate expression. |
| : | It separates the dimension declaration from the aggregate expression. |
| aggregate expression | This refers to the computation of the dimensions such as SUM of total sales, COUNT of customers, MIN of order date, etc., performed. |
How to use the Tableau Fixed function?
To use the Tableau Fixed function, you can follow the below steps:
Step 1: Launch Tableau Desktop on your machine.
Step 2: Navigate to File – Open to import the dataset to your Tableau Desktop.
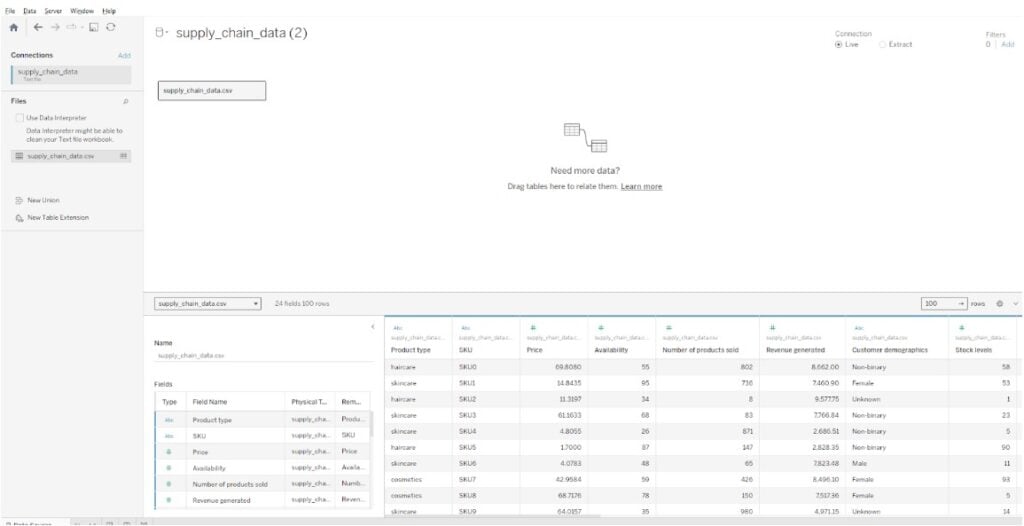
Step 3: Open a new worksheet tab. You will be able to view all the data fields of the imported dataset.
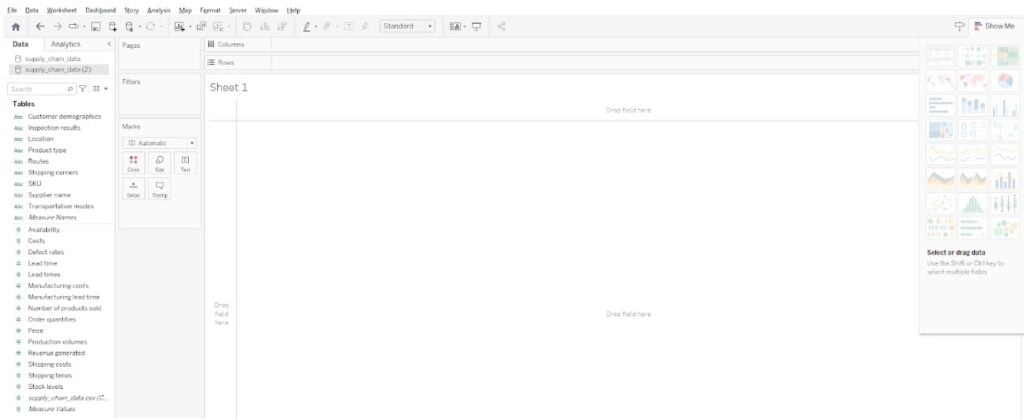
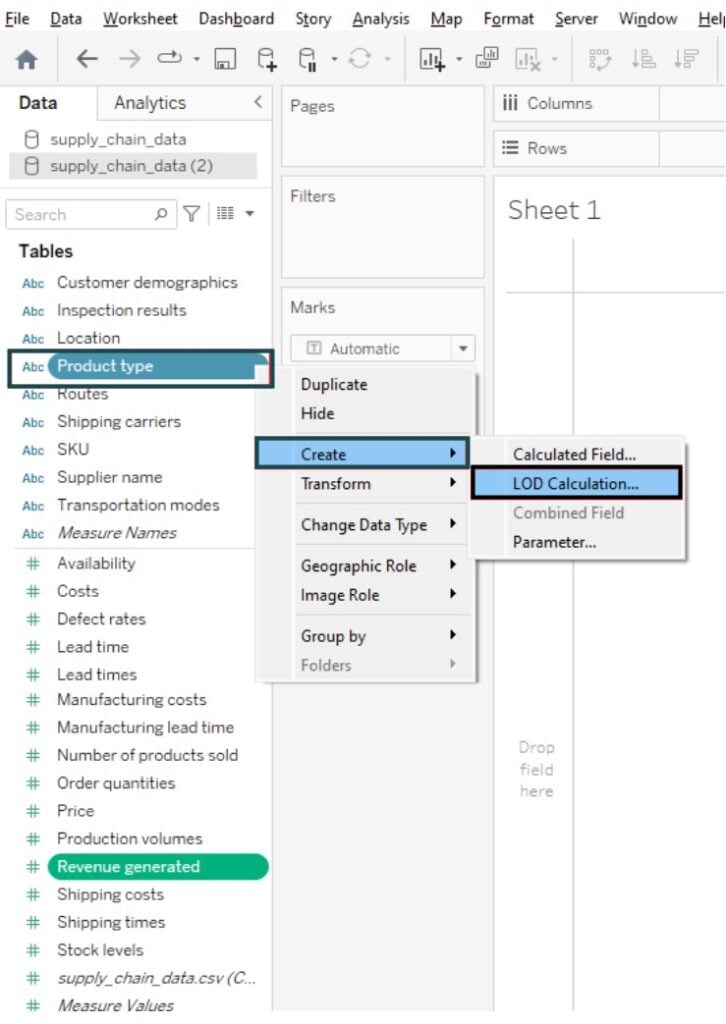
Step 4: In the Data pane, choose the measure you want to aggregate and then control-click the dimension you want to perform data aggregation.
For example, in this case, first choose the measure of revenue generated. Use the control key to select the dimension Product type and then click on the dimension to select the Product type – Create – LOD Calculation.
It will open up a pop-up window highlighting the calculation editor.
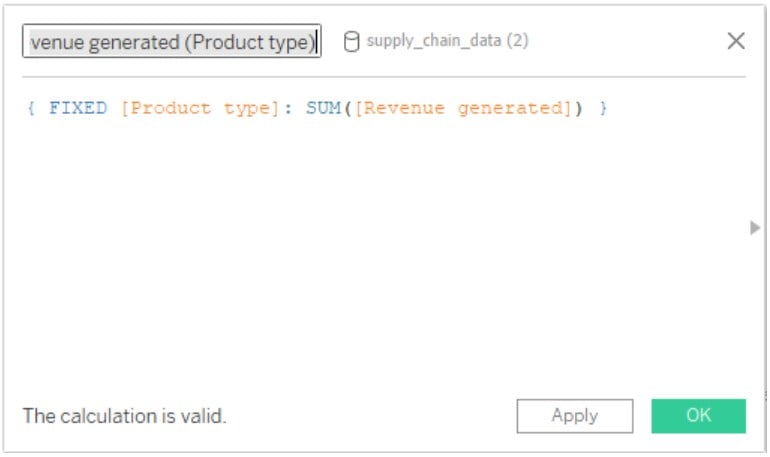
Step 5: Once the changes are completed, click on the OK button to apply changes and close the window.
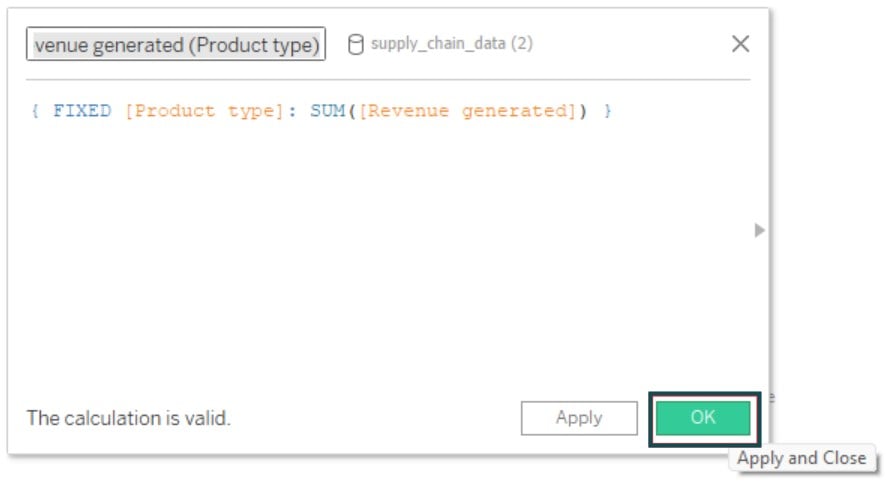
It will create a new measure in the Data pane.

Step 6: Drag and drop the dimensions and newly created measure to the view.

As you can see, the Revenue generated remains the same regardless of the granularity of the view level, i.e., Product type, Shipping carriers, and Customer demographics.
Note: You can also perform Tableau Fixed Rank calculations using the Fixed LOD expressions or combining the RANK function with the Fixed function. It will enable you to define the granularity at which you want to define the ranking. Similarly, you can also specify the Tableau Fixed with condition expressions for creating calculated fields for your visualization requirements. These may include logical expressions such as IF, and ELSE conditions for creating the fields.
For example, the below syntax will create the calculated fields based on the conditions specified.
{FIXED [<Dimension declaration>]: IF [Condition] THEN [<Aggregate expression>] ELSE [<other values>] END}
In the next section, we will demonstrate how you can use the Tableau Fixed function with the help of a few examples.
Examples
In this section, we will go through three different use cases demonstrating the use of the FIXED function in Tableau.
Example #1 – Profit Sum for each State and Sub-category
In this example, we will demonstrate how to create the profit sum for each state and sub-category using the Tableau Fixed function. For this demo, we have used the Product_Sales dataset, which contains detailed information on customer age, gender, product category, quantity, unit cost, and price, as well as revenue generated through sales of products listed in this dataset.
To use the Tableau Fixed function, follow the instructions below:
Step 1: Import the dataset using File – Open. Click on the New Worksheet icon to open a new sheet.

Step 2: In the Data pane navigation, select the Revenue measure. Hold the control key and then click on the State dimension. It will open a context menu. Select Create 🡪 LOD Calculation. It will create a Tableau fixed calculation.
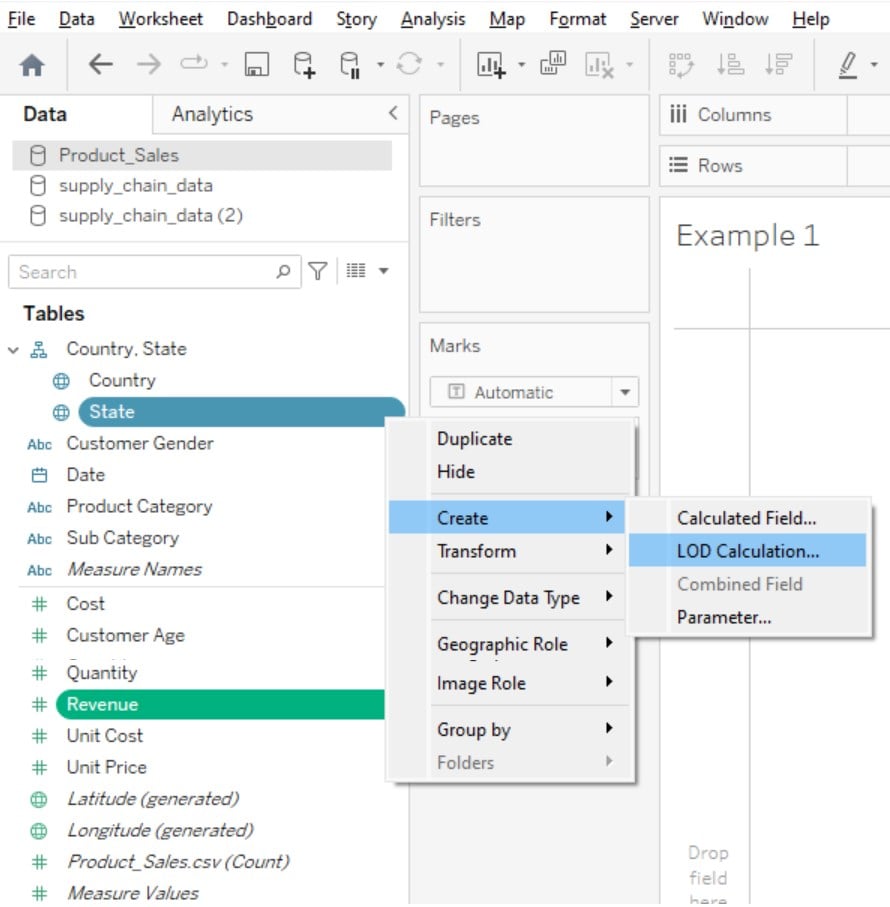
Step 3: This will open a calculation window with a Fixed level of detail expression, as shown below. Click on the OK button.

A new measure, Revenue (State), will be created in the Data pane.
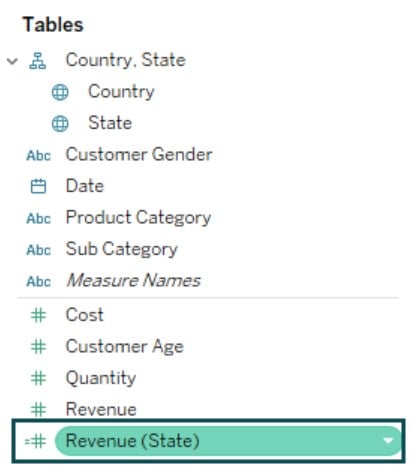
Step 4: Now select the newly created measure and then control-click the Sub Category dimension. Follow the instructions provided in Step 2 to create a LOD calculation. It will open the calculation window as shown below.

Step 5: Click on the OK button. You will notice that Tableau has created another measure in the Data pane.

Step 6: Now drag and drop the dimensions to the Rows section and the newly created measure to the Marks section. It will create a visualization, as shown below.
Note that the Profit Sum is repeated for each State and Sub Category dimension.

Example #2 – Sum of Sales by Region
Let’s now look at a different example where we will calculate the Sum of Sales by Region using the Tableau Fixed function. For this demo, we have used the Sales_Analysis_Data dataset that contains essential details such as Order Date, Region, Product Reference, Category, Sub-Category, Sales, Quantity, Profit, and State.
To use the Sum of Sales by Region, follow the instructions below:
Step 1: Import the dataset into Tableau Desktop using the File – Open feature.
Step 2: Open a new worksheet and select the imported dataset available under the Data pane.
Step 3: Create a calculated field using the Tableau fixed LOD by using the Quick LOD expression. For this, select the Sales measure and control-click on the Region dimension. Choose Region – Create – LOD Calculation to create Tableau fixed calculation.

Step 4: In the calculation window, click on the OK button to apply the Fixed LOD expression and save the changes.

Step 5: Now drag the dimensions to the Rows section.
Step 6: Drag the newly created measure to the Marks pane.
Step 7: Drag the dimension to the Color. It will create a data visualization, as shown below.

Example #3
In this example, we will demo another Tableau Fixed function usage, i.e., AVG, using the American Restaurants dataset.0020The American Restaurants dataset contains a rich selection of dining establishments, from cozy local eateries to renowned culinary destinations across different cities and states of America.
You may follow the instructions below to use the Tableau Fixed function:
Step 1: Select the American Restaurants dataset from your tableau Desktop using the File – Open navigator.
Step 2: Create a new worksheet by clicking on the new worksheet icon.
Step 3: Create a calculated field using Tableau fixed LOD expressions. To use this expression, select the measure (in this case Weighted Rating Value) and then control-click on the dimension (In this case State). Click on the State – Create – LOD Calculation to create the calculated field in the Data pane.

Step 4: This will open up the Tableau fixed calculation window. Specify the aggregate function to the Fixed LOD expression. In this case, we have specified the AVG function. Click on the OK button to apply the changes and close the window.
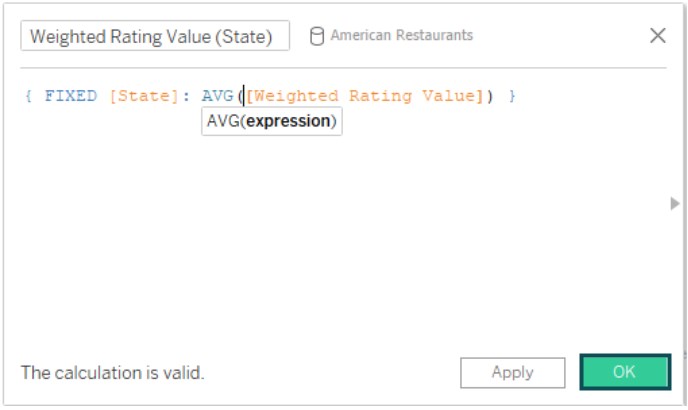
This will create a new measure Weighted Rating Value (State) in the Data pane.
Step 5: Drag and drop the dimensions to the Rows.
Here we have added Country and State to the Rows section.
Step 6: Drag and drop the newly created measure to the Marks pane.
Step 7: Drag and drop the Country dimension to the Color section.
This will create the data visualization as shown below.

Important Things to Note
- The Tableau Fixed function ignores the filters in the view other than any context filters, data source filters, or extract filters.
- You can specify a fixed function without any dimension declaration, which would imply the data aggregation or Tableau fixed calculation is applied to the entire table.
Frequently Asked Questions (FAQs)
The key difference between tableau fixed and included functions are outlined below:
Yes, you can combine the FIXED function with other Tableau functions or calculations. For example, you can use these functions with Date, aggregate functions such as SUM, AVG, MIN, MAX, etc., logical functions, and even customized calculations.
Some of the best practices or tips for optimizing the use of the FIXED function are highlighted below:
• Focus on specifying a meaningful name for the measure created using the Fixed function.
• If you are using the fixed function in a nested loop, consider the performance implications and outcomes before you recommend its usage.
• Consider using the EXCLUDE or INCLUDE tableau functions as alternative functions for your requirements as applicable.
In general, there are no differences in behavior between the FIXED function in Tableau Desktop and Tableau server. For more information, you may refer to the Tableau documents for any latest changes.
Yes, the FIXED function works with both the Live and Extract connections to the data sources. However, be careful while working with live connections as huge data volume may significantly impact the overall performance.
Recommended Articles
This has been a guide to Tableau Fixed. Here we explain how to use Fixed level of detail (LOD) with examples & points to remember. You can learn more from the following articles –

Leave a Reply