


Introduction
Many finance models still rely on manual “tweaking‑and‑rechecking” workflows: adjusting a discount rate, changing a growth assumption, or updating a capex figure, then noting the impact on NPV or cash flow. This approach is slow, error‑prone, and hard to audit, especially when the same changes must be tracked across multiple business cases. Excel What‑If Analysis with Copilot changes that by letting users describe the desired scenarios in plain language. YOu can specify them like “test three growth rates and show the impact on terminal value” or “find the break‑even discount rate for a project.”Copilot proposes the corresponding Data -> What‑If Analysis setup, Goal Seek, or Scenario Manager configuration. The analyst still owns the logic, but the AI accelerates the scaffolding so the model can be tested systematically and repeated across cases.
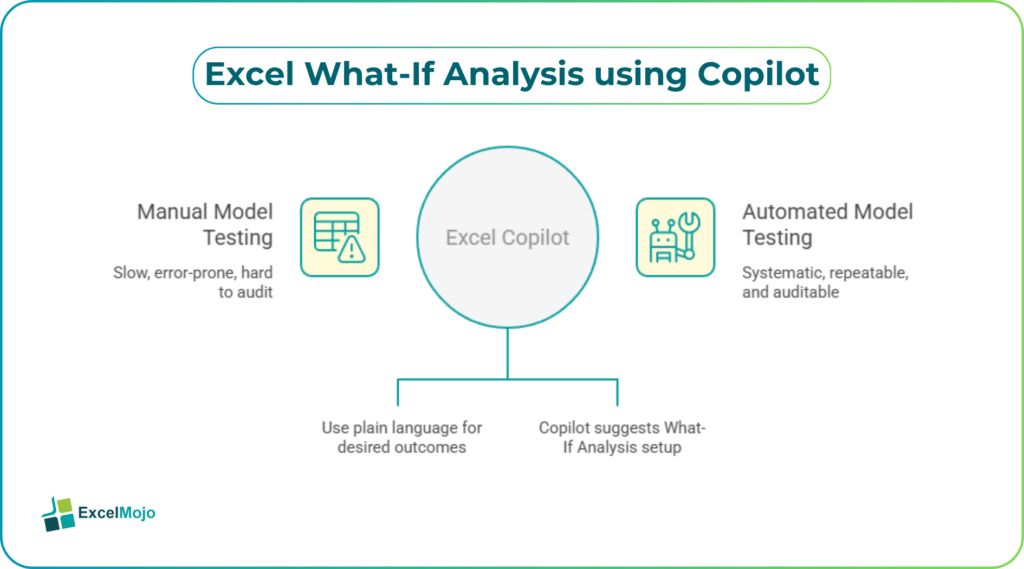
This article explains how Copilot integrates with Excel’s builtin What‑If tools, gives a practical example of scenario‑based modeling, and highlights common pitfalls and governance checks analysts should follow. The goal is to make What‑If analysis repeatable, auditable, and scalable across teams.
Excel’s What‑If Analysis suite includes three main tools: Goal Seek, Data Tables, and Scenario Manager, each designed to test how inputs affect outputs. Copilot in Excel sits on top of these tools, helping the user describe the desired scenario structure and then proposing the right built‑in setup.
How Excel What‑If Analysis with Copilot works
For example, a prompt such as “Create a Data Table that shows how NPV changes with discount rates from 6% to 14% in 1% increments” leads Copilot to suggest a one‑variable data table where the discount rate is the input cell and NPV the output. Copilot may also outline the layout: a column of discount‑rate values, a reference formula to the NPV, and the correct =TABLE() placement. Similarly, a request like “Set up three scenarios for low, base, and high growth” can trigger a Scenario Manager suggestion that maps the assumption cells to named scenarios and proposes a scenario summary report. The analyst then validates the mapping, runs the scenarios, and ties the output to dashboards or annexes.
Using Copilot for Scenario Automation
A structured workflow keeps scenario‑based modeling traceable and testable.
A practical example is seen below:
Step 1: Define the scenario structure
- Start with a clean model where key drivers (discount rate, growth rate, capex, revenue multiple, etc.) are in dedicated input cells or a named range.
- Use a consistent naming convention such as “Assumption_DiscountRate” so Copilot can refer to these cells correctly.
- Ask Copilot: “Use Scenario Manager to create three scenarios, Low, Base, and High, for growth rate and discount rate, and show a summary of NPV and terminal value.” Copilot will outline the changing cells, scenario values, and the expected layout of the summary sheet.
Step 2: Implement and test the scenarios
- In Excel, go to Data → What‑If Analysis → Scenario Manager and follow Copilot’s suggested mapping:
- Low: growth rate lower by 1%, discount rate higher by 1%.
- Base: current values.
- High: growth rate higher by 1%, discount rate lower by 1%.
- Use the Summary button to generate a new sheet comparing the three scenarios’ NPVs and terminal values.
- Test the layout by changing assumptions manually and re‑running the summary to confirm that the values update correctly.
This two‑step approach keeps the Copilot‑assisted scaffolding lightweight while leaving the analytical heavy‑lifting with the human. It also makes it easy to extend the pattern to new drivers or business cases later.
Pitfalls when Automating What‑If with Copilot
Even though Copilot can generate the right What‑If scaffolding, several subtle pitfalls can undermine the clarity and reliability of the output.
- Over‑simplified assumptions are the most common issue. Copilot may propose a symmetric swing around a base case (for example plus‑minus 1%) that is mathematically neat but economically unrealistic. Analysts should anchor scenario ranges in business drivers such as historical volatility, management guidance, or market benchmarks, and document the rationale in a “Assumptions Sheet.”
- Misaligned changing cells can break the scenario logic. If Copilot suggests a changing cell that is not the true driver (for example a formula result instead of the base input), the Scenario Manager or Data Table will not reflect the intended sensitivity. The analyst must ensure that all changing cells are hard‑coded assumptions or clearly defined variables, not derived outputs.
- Poorly organized summary outputs make the model hard to audit. A Copilot‑generated Scenario Summary with unformatted values and no clear row‑level labels can confuse reviewers. Best practice is to standardize the summary layout, add explanatory notes, and keep the summary sheet separate from the core model logic.
- Performance and maintenance can suffer if the same model is used for many Data Tables and Scenario Manager runs simultaneously. Large one‑variable or two‑variable tables can slow down the workbook, especially when tied to complex financial models. The best practice is to keep the most intensive tables on a separate “What‑If” sheet, and to precompute only the essential metrics for decision‑makers.
How to Validate and Document AI‑Assisted Scenarios
Validation ensures that Copilot‑assisted What‑If setups match business expectations and governance standards.
- Build a manual baseline: for a simple sensitivity (for example discount rate impact on NPV), compute a few key points manually and compare them with the Data Table or Scenario Manager output. Any discrepancies should be traced back to the input mapping or formula logic.
- Test edge cases: add extreme values such as very high growth or near‑zero discount rates and confirm that the model behaves as expected, without circular references or divide‑by‑zero errors.
- Document the scenario logic: keep the original Copilot prompt, the list of changing cells, the scenario values, and the assumptions behind each scenario in a hidden “Scenario Notes” sheet. This record supports audits and future model refreshes.
- Separate structural logic from presentation: keep the base model logic, input assumptions, and scenario definitions separate from dashboards or management‑ready exhibits, so that the core structure is easy to test and maintain.
A structured validation and documentation process keeps AI‑assisted What‑If analysis both robust and defensible, which is especially important in regulated or committee‑driven environments.
Conclusion
Excel What‑If Analysis with Copilot simplifies the setup of Goal Seek, Data Tables, and Scenario Manager tests by turning natural‑language descriptions into repeatable scenario structures. By clearly defining assumptions, validating the AI‑proposed scaffolding, and documenting the logic, analysts can build scalable, audit‑ready sensitivity analyses that support better capital‑allocation and strategic decisions. For finance teams, this combination of Copilot‑assisted automation and disciplined validation offers a practical upgrade from manual, ad‑hoc scenario testing.
Frequently Asked Questions (FAQs)
How does Copilot assist with Excel What‑If Analysis?
Copilot in Excel can interpret natural‑language requests such as “create a data table for discount rates from 6% to 14%” and propose the correct layout and changing cells for Data Tables, Goal Seek, or Scenario Manager. The analyst then implements the suggested structure, tests it, and tunes the parameters, while Copilot helps streamline the setup rather than replace the underlying model logic.
Can AI‑generated scenarios replace manual sensitivity testing?
AI‑assisted scenarios can automate much of the scaffolding, but analysts still need to validate the assumptions, ranges, and outputs against business expectations and historical data. Copilot can suggest symmetric swings or standard ranges, but the human must anchor those ranges in economic and operational reality, and document the rationale for each scenario.
Is Scenario Manager with Copilot suitable for complex financial models?
Scenario Manager can be used with complex models, provided the changing cells are clearly defined and the scenarios remain manageable in number and range. For large two‑variable tables or many scenarios, analysts should precompute critical metrics, limit the number of drivers per test, and keep the output in a dedicated “What‑If” sheet to avoid performance bottlenecks.
How do you choose the right What‑If method with Copilot?
When the focus is on one or two key inputs, Data Tables are usually the most efficient; for named, multi‑driver cases, Scenario Manager fits best; and for reverse‑engineered targets (for example, the break‑even discount rate), Goal Seek is appropriate. Copilot can suggest the right method from a plain‑language description, but the analyst should confirm that the chosen approach aligns with the decision‑making context and governance constraints.