


Introduction
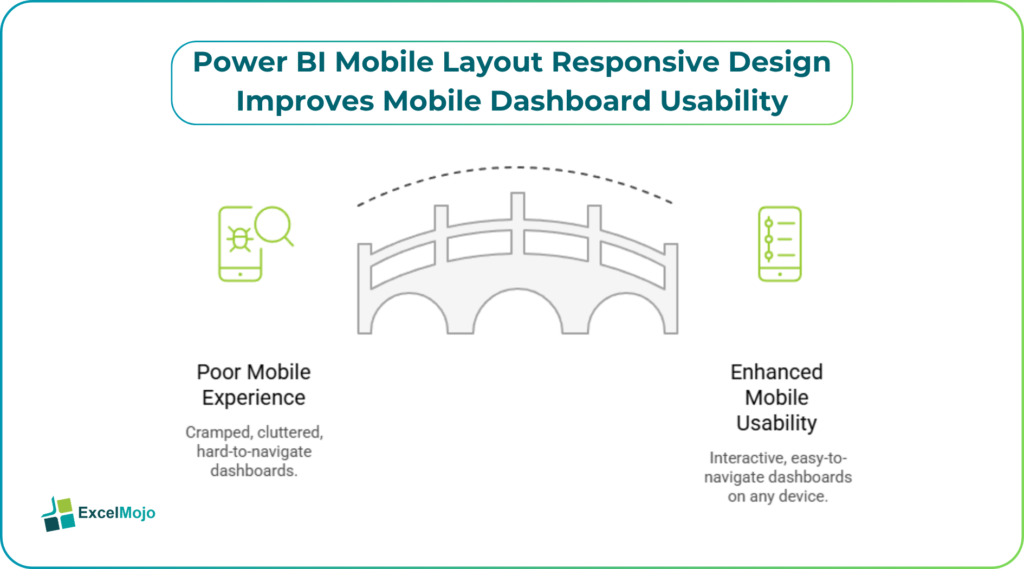
Most analysts still design dashboards for desktop monitors and then discover that the same layout feels cramped, cluttered, or hard to navigate when viewed on a phone. Executives and field teams increasingly rely on the Power BI mobile app, but zooming into tiny visuals, scrolling through fragmented tiles, and missing key filters undermines the report’s usefulness. Power BI mobile layout responsive design bridges this gap by using layout options, mobile views, and Copilot‑assisted suggestions to build layouts that adapt to screen size while preserving interactivity and business logic. This article shows how to structure reports for mobile, how to use Copilot to suggest layout improvements, and how to validate mobile‑optimized layouts before rolling them out. Readers will see a detailed example, learn how to avoid common layout pitfalls, and come away with a checklist that can be reused across dashboards.
How Power BI Mobile Layouts Work
Power BI mobile layout engine treats the report canvas as a flexible grid that can be re‑organized, resized, and stacked for smaller screens. In the Power BI service and the Power BI mobile app, admins and designers can enable and configure mobile views that present a tailored version of the report. The layout can rearrange visuals, adjust column widths, and stack elements vertically so that the user does not need to pinch‑zoom constantly. Power BI also respects the underlying data model and interactivity, so filters, drill‑throughs, and slicers still work the same way, just in a compacted form.
Copilot’s role in Power BI mobile layout responsive design is to suggest re‑organizations that align with usability best practices. For example, it can propose grouping related visuals into sections, moving key metrics near the top, or simplifying busy charts into summary cards on mobile. The analyst’s job is to review those suggestions, test them, and lock down the layout so that it still tells a clear analytical story on a small screen.
How to use Copilot to Design Responsive Layouts
Copilot accelerates the move from desktop‑centric design to responsive, mobile‑optimized layouts by turning natural‑language requirements into concrete layout proposals.
A practical workflow:
- Publish the report and open the mobile view settings in the Power BI service.
- Activate Copilot and submit a prompt such as “Create a mobile‑optimized view that shows KPI cards, a compact trend line chart, and a summary table, with filters at the bottom.”
- Review the suggested layout: verify that the critical visuals are visible above the scroll fold, that text labels are readable, and that interactive filters are easy to tap.
- Adjust the layout manually: resize cards, reorder pages, collapse less‑critical tabs, and test navigation on the mobile app.
- Document the layout decisions and performance notes (such as which visuals are hidden or simplified on mobile) in a hidden “Mobile Design” page of the report.
This workflow keeps the AI in the assistant role while the analyst owns the final UX and business logic, which is essential in governance‑heavy environments.
Example: Optimizing a Sales‑Performance Report for Mobile
A common use case is a sales‑performance dashboard that works well on desktop but becomes unwieldy on mobile. The goal is to keep the mobile layout responsive while preserving the story: “show revenue, target, and trend by region, with a simple filter for time period and region.”
Two‑line, step‑wise elaboration:
Step 1 – Prepare the layout and solicit AI suggestions
Step 2 – Refine and test the responsive structure
- Manually resize the KPI cards so that each metric label is legible without zooming, reduce the chart height, and remove redundant legends that consume vertical space. Move the primary slicers to the bottom of the page so they stay in reach but do not dominate the screen.
- Test the layout on a real phone, checking scrolling behavior, font size, and tap‑accuracy on filters; then iterate by simplifying any remaining busy visuals and validating that key achievements and variances are still prominent.
This example shows how Power BI mobile layout responsive design transforms a dense desktop layout into a focused, scannable mobile view without losing the core narrative.
Pitfalls and Best‑Practice Tips
Mobile layouts introduce several subtle risks that can undermine usability and performance if not addressed.
- Over‑cluttering the mobile view is perhaps the most common pitfall. Analysts sometimes copy their desktop layout exactly and simply shrink the visuals, which forces users to zoom in and out constantly. The better practice is to prioritize a small number of key visuals, hide secondary charts, and use summary cards or KPIs that fit the screen width.
- Neglecting interactivity is another risk: interactive elements such as filters and drill‑throughs must be large enough to tap with a finger and not hidden behind other visuals. Use enough padding, group related controls, and avoid overlapping elements that can cause accidental selections.
- Ignoring different orientations and device sizes undermines the “responsive” part of the design. A layout that works well in portrait on a phone may look too sparse or too crowded in landscape on a tablet, so analysts should test both modes and adjust breakpoints or layout settings as needed.
- Performance issues can creep in when heavy visuals, such as high‑resolution maps or large tables, are forced into a mobile view. The best practice is to simplify or aggregate those visuals on mobile, preload key measures, and rely on backend filters rather than front‑end recalculations.
By following these guidelines, teams can keep their Power BI mobile layouts clean, fast, and aligned with user expectations.
Conclusion
Power BI mobile layout responsive design turns desktop‑centric dashboards into mobile‑friendly experiences by leveraging layout options, mobile views, and Copilot‑assisted suggestions. By focusing on key metrics, simplifying busy visuals, and testing across devices, analysts can create dashboards that work seamlessly on phones and tablets without sacrificing analytical depth. This approach keeps stakeholders engaged and informed wherever they are while maintaining the integrity of the underlying model and governance standards.
Frequently Asked Questions (FAQs)
How does Copilot help with mobile layout design?
Copilot can suggest layout reorganizations such as stacking KPI cards, simplifying charts, and repositioning filters to make the dashboard more usable on small screens. Analysts can review and refine those suggestions rather than starting from scratch, which speeds up the design process. The suggestions are grounded in usability heuristics and Power BI’s layout capabilities, but the final decisions rest with the human designer.
Can AI fully automate the mobile layout for a Power BI report?
No. AI‑based layout suggestions are a starting point, not a finished product. The analyst must test the proposed layout on real devices, validate performance, and ensure the analytical story remains clear for the target audience. AI cannot replace judgment about business priorities, governance constraints, or stakeholder preferences, so human oversight is essential.
What are the key differences between desktop and mobile layouts in Power BI?
Desktop layouts can spread visuals across a wide canvas, whereas mobile layouts must stack and prioritize a smaller set of visuals to fit the screen. On mobile, analysts often hide or simplify secondary charts, increase font sizes, and group controls that are easy to tap. The underlying logic and filters remain the same, but the presentation is optimized for touch interaction and shorter viewing sessions.
How often should mobile layouts be revisited as data models change?
Mobile layouts should be revisited whenever the underlying model undergoes major changes, such as adding a new dimension, changing time grains, or introducing new KPIs. Frequent minor changes may not require a full layout overhaul, but periodic checks ensure that the mobile view still reflects the current business narrative. A lightweight design‑review cadence, perhaps aligned with quarterly model refreshes, works well in practice.