


Introduction
Dynamic arrays in Excel, such as FILTER, UNIQUE, SORT, and SEQUENCE, have transformed how analysts build spill ranges that auto‑expand or auto‑collapse as data changes. However, writing and debugging these formulas, especially when nested or filtered by multiple conditions, can still feel like guesswork. Excel Dynamic Arrays ChatGPT spill range mastery helps by using AI to propose clean, efficient spill‑range formulas. It also explains how spilling works, and suggests fixes when the spill clashes with existing content. Here, we learns how to use AI‑assisted prompts to design, test, and refine dynamic‑array formulas so spilling behaves predictably and supports large‑scale dashboards.
This article walks through a practical workflow for using AI‑assisted prompts to design dynamic arrays, how to validate spill behavior, and common traps to avoid. We give a step‑by‑step example, quick validation formulas, and governance tips so their spill‑range logic is production‑ready.
How Dynamic Arrays and Spilling Work
Dynamic arrays are formulas that return multiple values to a range of cells, which Excel then “spills” into adjacent cells until the entire result set is written. The spill range is highlighted with a blue border when the formula is selected. If something blocks the spill range (for example, a merged cell or existing data), the formula returns a #SPILL! error.
AI‑assisted formulas can speed up the design by providing correct FILTER, SORT, UNIQUE, or SEQUENCE logic and explaining how to avoid blocking the range. For example, AI can suggest the right criteria, adjust the range to avoid pre‑existing data, and propose using @ references in structured tables or TAKE and DROP to handle partial ranges.
Using ChatGPT to Generate Spill‑Range Formulas
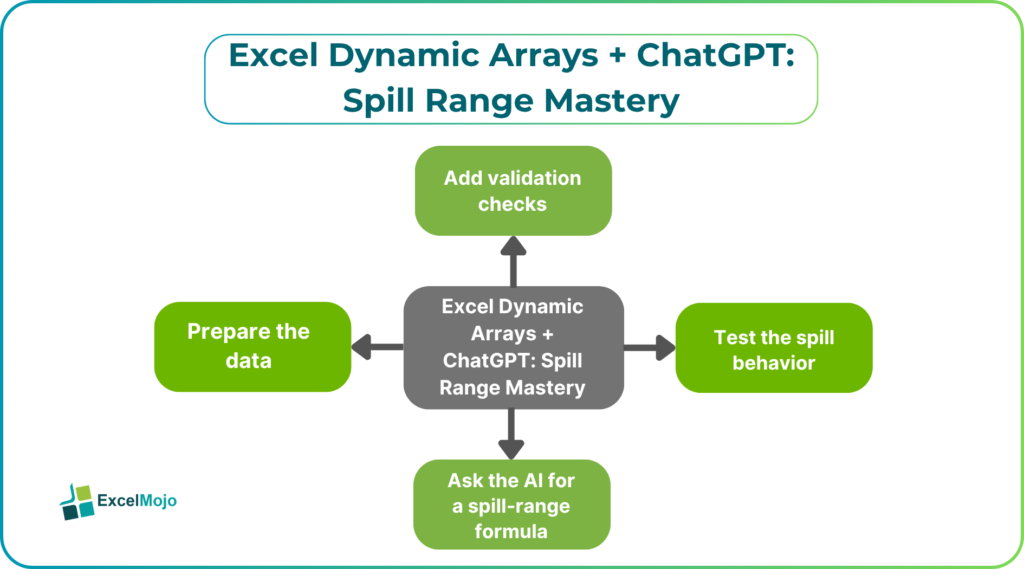
A practical workflow keeps dynamic‑array creation traceable and testable.
- Prepare the data: ensure the source table is structured and uses consistent field names. Structured tables and named ranges help AI understand the schema and produce correct formulas.
- Ask the AI for a spill‑range formula: for example, “Write a FILTER formula that returns all rows where Region = ‘West’ and Revenue > 1000, and drops Region from the output.” AI can return
=FILTER(Table1, (Table1[Region]=”West”)*(Table1[Revenue]>1000), “”)
and explain how to adjust the range to avoid spilling into occupied cells. - Test the spill behavior: clear the spill area, paste the formula, and confirm the result expands as expected. If the spill clashes with existing data, add a helper column or move the formula to an empty area.
- Add validation checks: use COUNTA or ROWS on the spill range to confirm the number of rows matches expectations.
- Document the formula and assumptions in a hidden sheet for auditability.
This pattern mirrors how AI‑assisted coding works elsewhere: the AI drafts the formula, and the analyst validates and tests it before deployment.
Example: Building a Spill‑Based Dashboard
A concrete example shows how AI‑assisted formulas can simplify dynamic‑array design.
- Data: a table with columns Region, Product, Revenue, and Margin.
- Objective: build a spill range that shows Product, Revenue, and Margin for Region = ‘West’ and Revenue > 1000.
Formula pattern suggested by AI:
=FILTER(Table1[[Product,Revenue,Margin]], (Table1[Region]=”West”)*(Table1[Revenue]>1000), “”)
This formula spills horizontally and vertically as needed, providing a clean table of results. The analyst can then use SORT or UNIQUE on the spill range to further refine the output.
Testing: move the formula to an empty area, confirm that it spills without errors, and use COUNTA or ROWS to validate that the number of rows matches expectations. If the formula clashes with existing data, move the spill range or adjust the destination.
Pitfalls and Best‑Practice Tips
Dynamic arrays are powerful but can create subtle issues if not handled carefully.
- Avoid blocking the spill range: keep the spill area clear of merged cells, existing data, or formulas that might overwrite the spill. If the spill cannot be cleared, adjust the formula to a different location or use a helper table.
- Use absolute ranges wisely: when referencing external tables, use structured references or named ranges to avoid spills changing size unexpectedly.
- Watch for performance: large FILTER operations on millions of rows can slow the workbook. Use indexes or summarization to reduce the source size when possible.
- Validate spill behavior: test the formula with a small dataset first, then scale up, and confirm that the spill range updates correctly as the source data changes.
These practices keep spill‑range logic transparent and efficient, reducing the risk of #SPILL! errors and performance issues.
Frequently Asked Questions (FAQs)
How does AI help with spill‑range formulas?
AI can generate formulas such as FILTER, SORT, UNIQUE, or SEQUENCE patterns that match the requested logic, explain how spilling works, and suggest how to avoid blocking the spill range. Analysts test and validate the formulas before deployment.
Can AI replace manual formula writing?
No. AI‑based formulas are a template that must be tested, validated, and documented. The analyst retains ownership of the final logic and the spill‑range setup.
How do you handle large spills efficiently?
Use indexes or summarization to reduce the source size, ensure the spill range is clear, and test with a small dataset before scaling up. Performance‑intensive spills can be moved to a separate sheet or summarized before spilling.
What are common pitfalls with spill ranges?
Blocking the spill range with existing data or merged cells is the most common issue. Also, large spills can slow the workbook, so analysts should monitor performance and adjust formulas as needed.