


Claude for Pivot Tables in Reporting
Pivot tables remain one of the fastest ways to turn raw data into useful summaries in Excel. They help analysts group records, compare categories, and spot trends without building complex formulas from scratch. The challenge is that many users still spend too much time deciding how to structure the table, what to summarize, and how to explain the output. That is where Claude for pivot tables becomes useful. It can help translate a reporting question into a cleaner pivot table setup and then turn the result into plain-English analysis.
For finance, operations, and analytics teams, this matters because reporting is rarely just about the numbers. It is also about the story behind the numbers. Claude can help users move from “what happened?” to “why did it happen?” faster by assisting with layout, summarization logic, and written commentary. It does not replace Excel skill, but it can reduce the time spent on repetitive reporting work. This article explains how Claude supports natural language reporting in Excel and where it fits best in a real workflow. This article explains how Claude can help users build, summarize, and narrate pivot table reports in Excel more quickly and clearly.
Why Pivot Tables Still Matter
Pivot tables are valuable because they simplify large datasets without needing a long formula chain. A well-built pivot table can show revenue by product, expenses by region, or units by month in just a few clicks. The problem is that many users still need to think through the structure manually before the output becomes useful. They have to decide which field belongs in rows, which metric belongs in values, and what filters will make the analysis meaningful.
Claude helps by reducing that setup friction. Instead of starting with a blank worksheet, the user can describe the reporting goal in plain language and get a more structured plan. For example, a finance analyst can ask for a sales summary by month and region, then use Claude’s guidance to build the pivot table faster. That is especially useful when the same reporting format repeats every week or month. The pivot table still does the work, but Claude helps shape the question and the output.
How Claude Helps With Setup
Claude is strongest when the user already knows the business question but needs help converting that question into Excel structure. It can suggest which fields should be used for rows, columns, filters, and values. It can also help users decide whether the report needs counts, sums, averages, or percentages. That kind of guidance is useful because many reporting errors happen before the pivot table is even built.
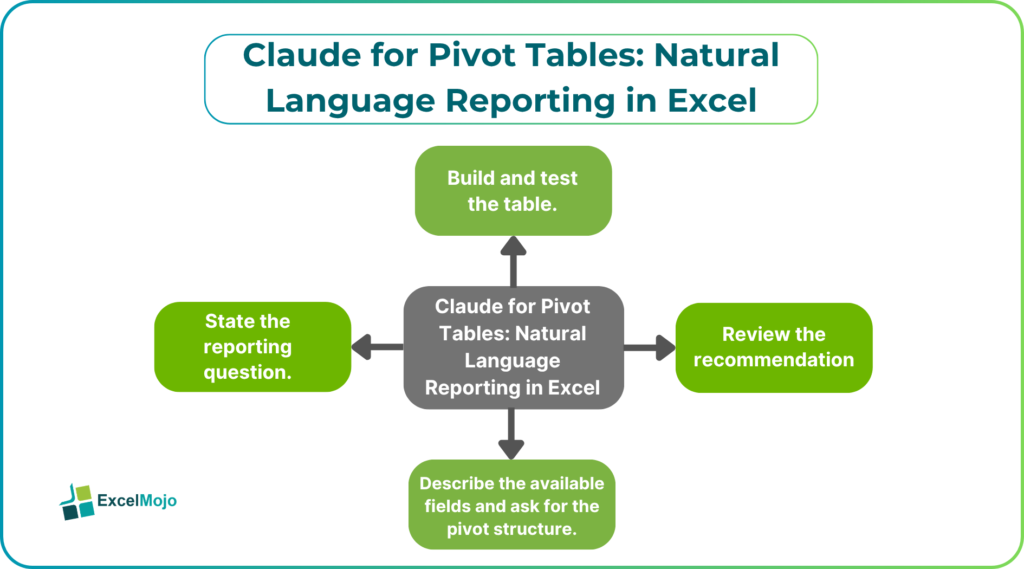
A practical workflow looks like this:
- State the reporting question.
For example, ask for sales by region, margin by product, or expenses by department. - Describe the available fields.
List the columns in the source data so Claude can map the logic correctly. - Ask for the pivot structure.
Request a row, column, filter, and value layout that matches the reporting goal. - Review the recommendation.
Check whether the suggested setup actually answers the business question. - Build and test the table.
Confirm the totals, filters, and grouping before using the report.
This workflow keeps the user in control while making setup faster and more consistent. It is particularly useful in teams where multiple people build reports and need the same logic applied each time.
Natural Language Reporting in Excel
Natural language reporting is where Claude becomes especially valuable. Many Excel users can build a pivot table, but fewer can quickly explain what the table means in a clear, polished way. Claude can help turn summary data into a readable explanation, which is useful for dashboards, monthly reports, and management reviews. Instead of writing commentary from scratch, the analyst can use the pivot output as the basis for a short narrative.
For example, if a pivot table shows that revenue increased in one region but fell in another, Claude can help frame the story around the drivers behind those changes. It can also help describe concentration, seasonality, or shifts in contribution across products and departments. The key value here is speed with clarity. The data still comes from Excel, but Claude helps translate it into reporting language that non-technical stakeholders can understand.
Better Ways To Use Claude
Claude works best when it is used before and after the pivot table rather than instead of it. Before the table is built, it can help design the structure. After the table is built, it can help explain the result. That makes it a useful layer around the reporting process, especially for teams that need both analysis and narration.
It also helps with recurring templates. A monthly performance report often uses the same fields every cycle, which makes it ideal for a Claude-assisted workflow. The user can ask for the same pivot layout each time, then adjust the filters and commentary as needed. This saves time and reduces the chance of building reports differently from one period to the next. It also helps keep the reporting style more consistent across teams.
Another strong use case is scenario comparison. If a pivot table shows actuals versus budget or current month versus prior month, Claude can help describe the variance in a simple way. That gives finance teams a faster path from raw summary to useful explanation.
Common Pitfalls
One common mistake is giving Claude a vague reporting request. If the question is broad, the answer will usually be broad too. A better prompt should include the reporting goal, the fields in the source data, and the type of summary needed. Without that context, the output may be too generic to help.
Another mistake is trusting the narrative without checking the underlying numbers. Claude can help explain a pivot table, but it cannot validate the data source by itself. If a field is mislabeled or the source data is incomplete, the commentary may sound correct while the numbers are still wrong. That is why the analyst should always review the pivot output inside Excel before using the explanation in a report.
A third issue is overcomplicating simple reports. Not every summary needs AI help. If the pivot table is basic and the commentary is short, manual work may be faster. Claude is most useful when the reporting process repeats, the data is large, or the explanation needs to be polished for stakeholders.
Why Analysts Benefit
For analysts, the real advantage of Claude is not that it replaces pivot tables. It is that it helps make them more useful. A pivot table gives structure, but Claude helps turn that structure into a clear reporting story. That combination is valuable in finance, operations, and BI work, where speed and clarity both matter.
It also helps reduce the time spent on repetitive explanations. Instead of rewriting the same monthly commentary from scratch, teams can use Claude to draft a first version and then refine it with their own judgment. That leaves more time for analysis, which is where human review still matters most. In practice, this can improve both reporting speed and communication quality.
Conclusion
Claude for pivot tables makes natural language reporting in Excel more practical. It helps users plan the table structure, summarize the output, and explain the story behind the numbers more quickly. That is useful for finance and analytics teams that need repeatable reporting without spending too much time on manual commentary. The best approach is to use Claude as a reporting assistant, not a replacement for Excel. Let it help with setup, interpretation, and narrative drafting, then confirm the numbers inside the workbook. When used that way, it can make pivot table reporting faster, clearer, and easier to repeat across reporting cycles.
Frequently Asked Questions (FAQs)
Can Claude build pivot tables in Excel?
Claude can help plan the pivot structure and suggest how the fields should be arranged, but the actual pivot table still needs to be built in Excel. It is best used as a reporting guide rather than a direct replacement for spreadsheet work.
How does Claude help with natural language reporting?
It can turn pivot table results into short written summaries that explain the main changes, patterns, or variances. That is useful for dashboards, reports, and management commentary.
Is Claude useful for monthly reporting?
Yes. It is especially helpful when the same pivot table format repeats every month. It can speed up setup and make the commentary easier to draft.
Should users trust Claude’s explanation of pivot results?
They should review it carefully. Claude can help write the story, but the analyst still needs to confirm that the pivot table numbers are accurate and complete.