What is the Power BI Union function?
The Power BI Union is a table manipulation function that combines multiple tables and creates a single table with merged values. The Power BI Union all tables feature is similar to a join functionality in SQL and other BI tools. When you use the Union function, Power BI adds the records from each specified table or table expressions into a single merged table. This function can be helpful in creating a consolidated dataset where you have multiple datasets with similar data fields but different values for data visualization.
Table of contents
Key Takeaways
- The Power BI Union function combines multiple tables and creates a single table with merged values.
- It returns a table that combines the records from each of the input table expressions.
- You can use the Power BI Union function in the DAX expression to combine or join rows from multiple tables.
- Consider the limitations of the Power BI Union before you recommend using it for your data manipulation.
- There are alternatives to Power BI Union functions, such as Merge or Append in Power Query, which you can use for table manipulation.
Syntax
The Power BI Union function has the below syntax:
UNION(<table_expression1>, <table_expression2> [,<table_expression>]…)
This function accepts at least 2 input parameters that include:
- Table_expression1: It can be a table or DAX expression that returns a table
- Table_expression2: It can be a table or DAX expression that returns a table
The Power BI Union function returns a table that combines the records from each of the input table parameters.
In the next section, we will see how you can use the Power BI Datediff function with a step-by-step instructions guide.
How to use the Power BI Union function?
To use Power BI Union, follow the step-by-step instructions outlined below:
Step 1: Launch the Power BI Desktop on your system.
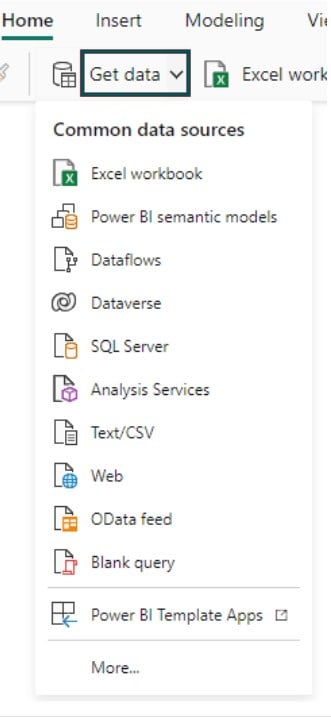
Step 2: On the Home tab, select the Get data option. Choose your dataset using the system navigator. Import the dataset and load it into Power BI using the Load button.
Step 3: Navigate to the Modeling tab and click on the New table option.

Step 4: In the formula bar prompt, specify the logic for the calculated table by using the DAX expression for the Union function. Hit the Enter key or click on the Commit icon on the Power BI screen to save the changes.
Step 5: Navigate to the Table view pane to view the newly created table.
Note: You can also perform Power BI union and summarize by combining the Union and summarize functions together in DAX expression. For example, you can use the below syntax:
TotalProfit =
UNION (
SUMMARIZE(Table1, Table1[Month], “Book”, SUM(Table1[BookProfit])),
SUMMARIZE(Table2, Table2[Month], “Articles”, SUM(Table2[ArticleProfit]))
)
Examples
In this section, we will demonstrate different use cases of the Power BI Union function through different examples.
Example #1 – Two tables distinct
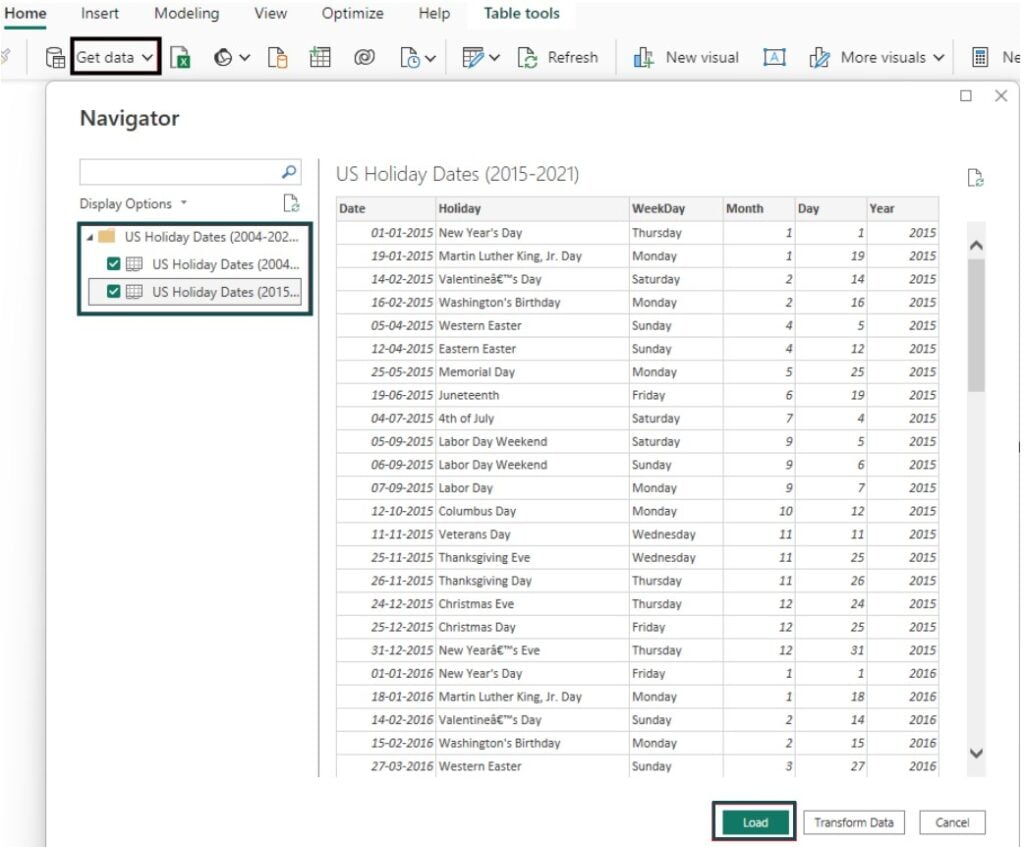
In this example, we will demonstrate combining two tables to join only distinct records from each table using the Union function in Power BI. To demonstrate this example, we will use two tables: US Holiday Dates (2004-2015) and US Holiday Dates (2015-2021) datasets. These two tables contain holiday dates from 2004 to 2021 in the US.
To combine two tables with distinct values using the Union function, follow the steps outlined below:
Step 1: In Power BI Desktop, navigate to Home – Get data. Select the dataset using the system navigator and import it into Power BI by clicking on the Load button.
Step 2: Navigate to the Modeling tab and select the New table option.

Step 3: Specify the logic for the calculated table in the formula bar prompt using the DAX expression.
Here, we have used the Union function to join US Holiday Dates (2004-2015) and US Holiday Dates (2015-2021) datasets, and then the Distinct function to Power BI union removes duplicates.
US Holiday Dates = DISTINCT(UNION(‘US Holiday Dates (2004-2015)’,’US Holiday Dates (2015-2021)’))

Click on the Commit icon to save the changes.
Step 4: Navigate to the Table view pane to view the newly created table. Note that the combined table has only distinct records from both table expressions.
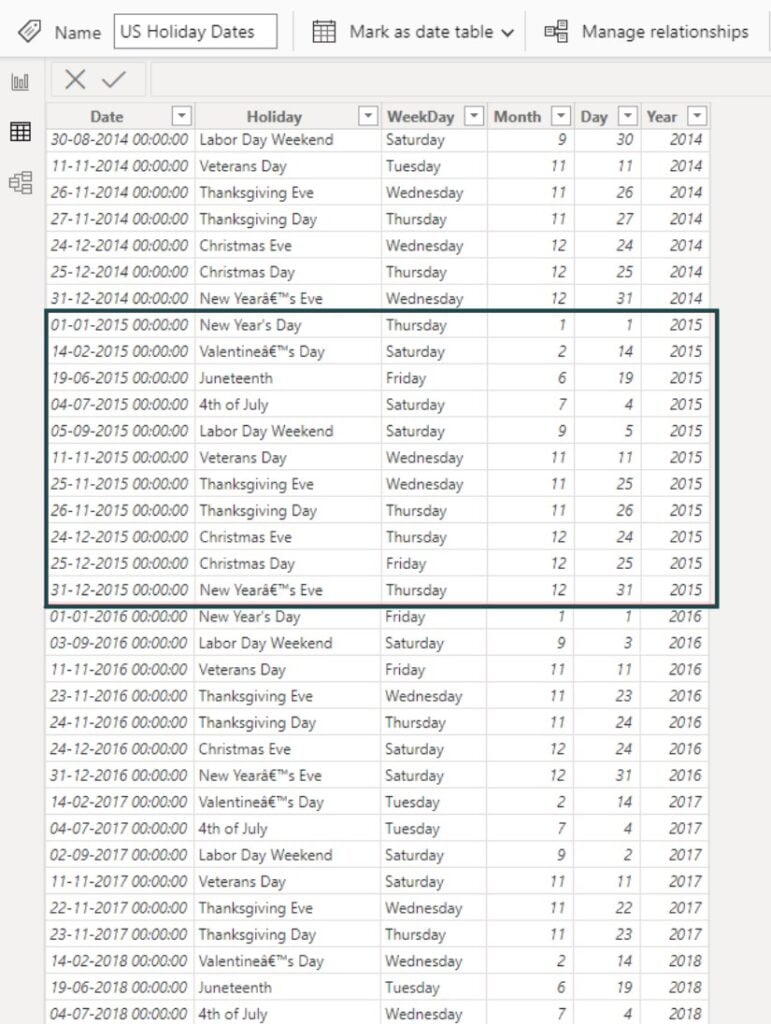
Note that US Holiday Dates (2004-2015) contains rows for the Year 2015.
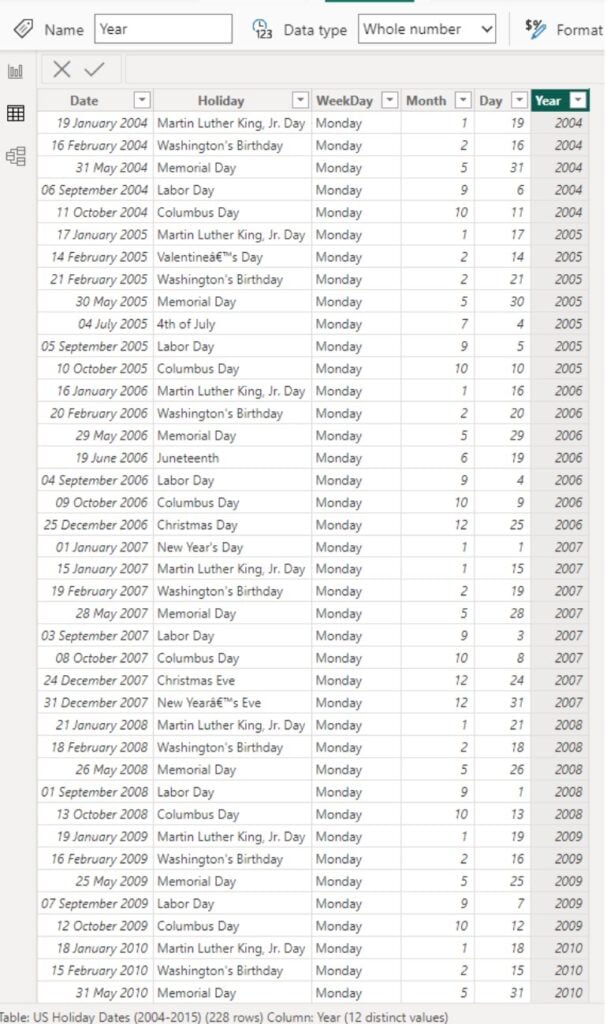
Similarly, US Holiday Dates (2015-2021) contains rows for the year 2015.

Example #2 – Two tables select columns
Let us now look at how we join two tables by selecting some of the existing columns using the UNION function. To demonstrate this example, we have used two datasets i.e. Burger_nutrition and Pizza_nutrition. These datasets contain Nutritional Values, Micronutrients, and Calories for burger and pizza brands based on the data collected from various fast food restaurants.
Follow the steps highlighted below to use the Union function for two tables and select columns in Power BI:
Step 1: Click on the Get data option in the Home tab. From the navigator, choose the datasets. Click on the Load button to load the data into the Power BI data model.
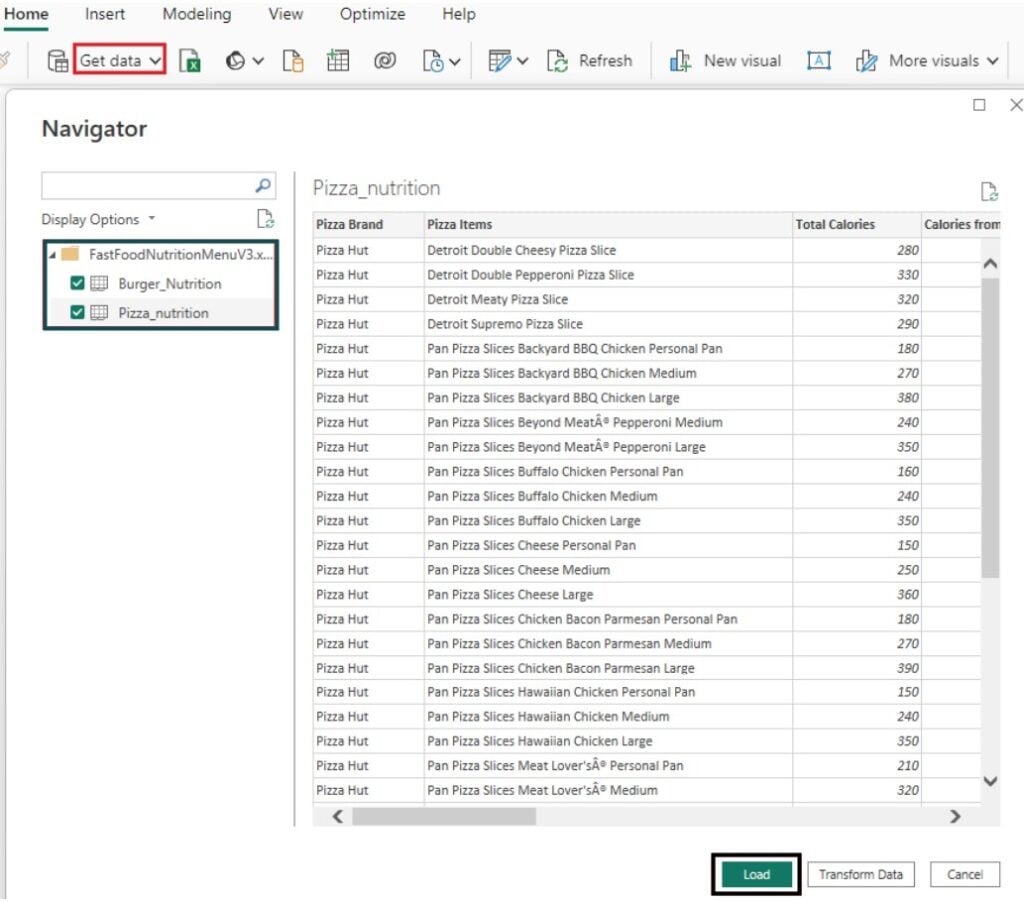
Step 2: Navigate to the Modeling tab. Choose the New table option.

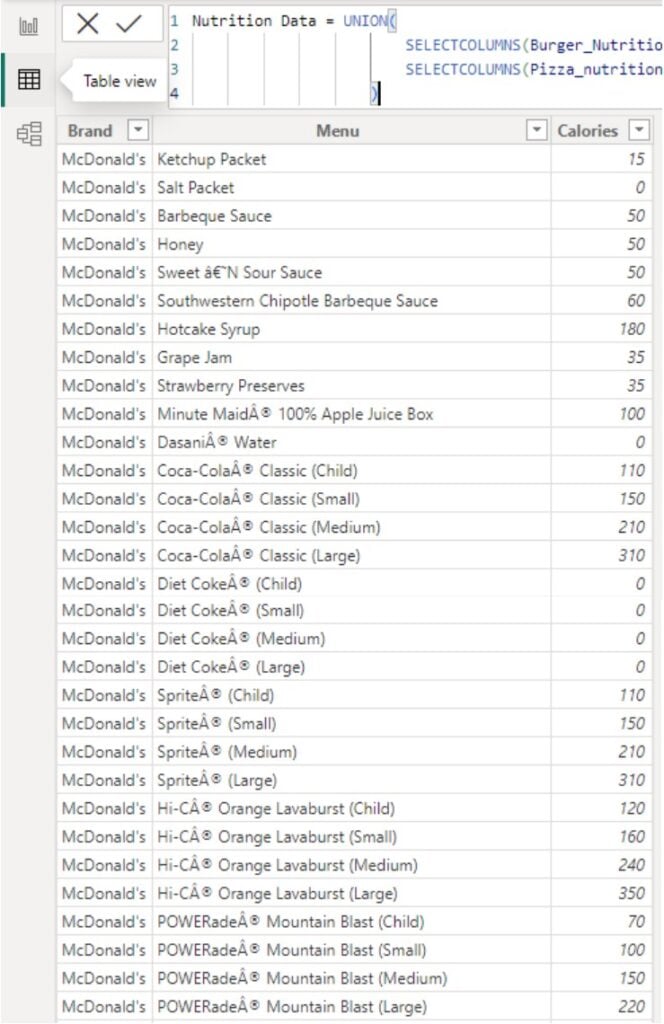
Step 3: In the formula bar prompt, specify the table name along with the logic to create the table. Here, we have used Union along with the Selectcolumn function to create the table. We have not selected all the columns from both the tables. For each column, we have specified the header as well.
Nutrition Data = UNION(
SELECTCOLUMNS(Burger_Nutrition, “Brand”,Burger_Nutrition[Burger Brand], “Menu”, Burger_Nutrition[Burger Menu], “Calories”, Burger_Nutrition[Total Calories]),
SELECTCOLUMNS(Pizza_nutrition,”Brand”,Pizza_nutrition[Pizza Brand], “Menu”, Pizza_nutrition[Pizza Items], “Calories”, Pizza_nutrition[Total Calories])
)

Once the changes are specified, click on the Commit icon to save the changes.
Power BI will create a table with selected columns from the two tables.
Step 4: Navigate to the Table view pane. You will see the newly created table with the columns and values from both tables as per the DAX expression.
Example #3 – Two tables Power Query
In this example, we will demonstrate the merging of two tables with different datasets in Power Query. As you know, Power Query provides two key features, i.e., Merge and Append functions, using which you can join two tables. For this demonstration, we have imported Sales_data and customer data to Power BI. These datasets contain the sales data description such as invoice, customer ID, price, quantity, etc., and customer information, respectively. To join these two tables in Power Query, follow the instructions outlined below:
Step 1: Use the Get data feature to import the dataset into Power BI.
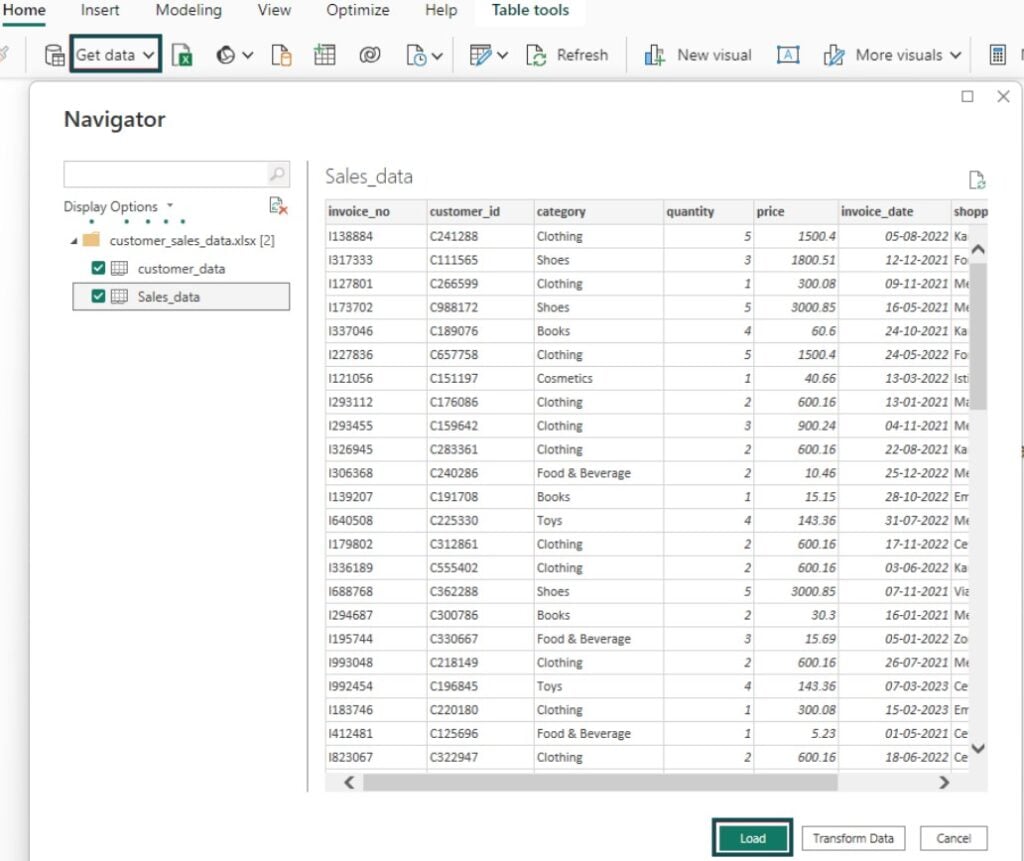
Step 2: Right-click on the imported table. From the context menu, select the Edit query option.
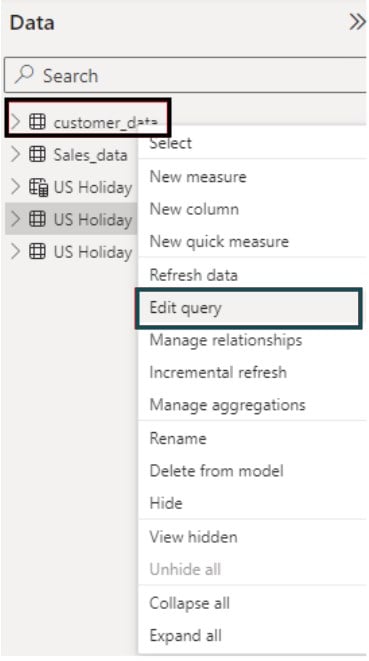
It will take you to the Power Query Editor window. You can view the tables in the Queries pane.

Step 3: Under the Home tab, choose Merge Queries – Merge Queries as New option in the Combine pane.

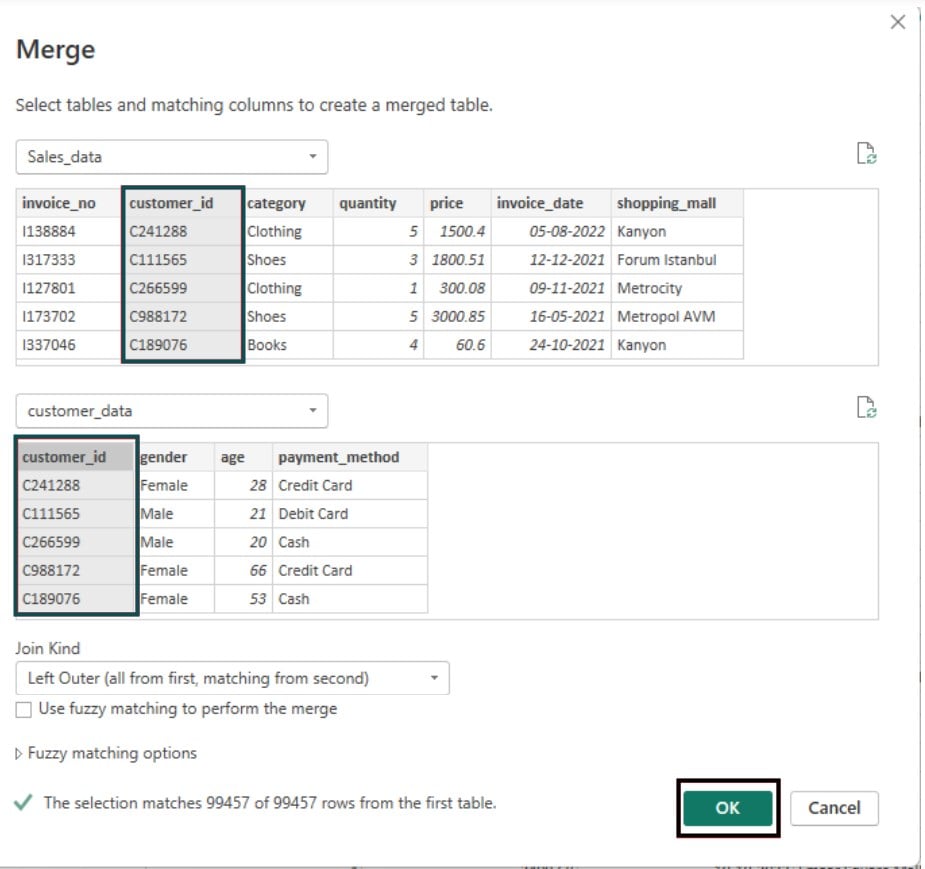
Step 4: In the Merge window, select the tables and matching columns to create a merged table. Specify the join type and click on OK.
Here, we have selected customer_id as the matching columns between the sales_data and customer_ data tables. The join type is specified as Left outer to pull out all the records from sales_data and only matching rows from the customer_data.
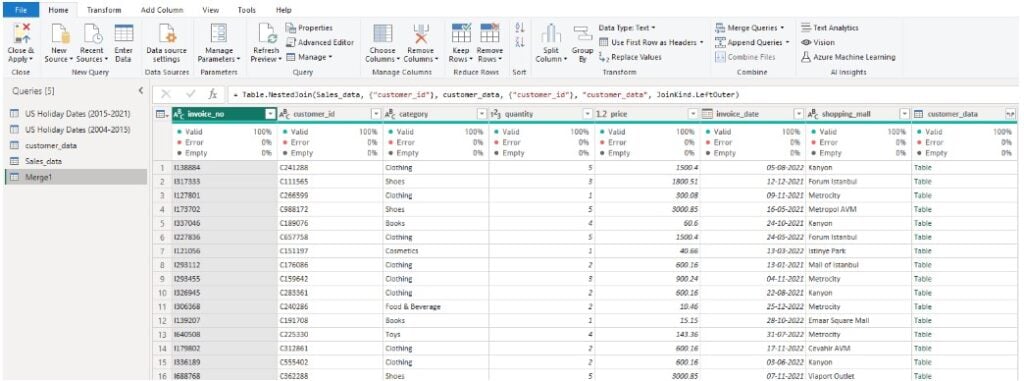
Once the data merging operation is over, you can view the merged table along with the columns.
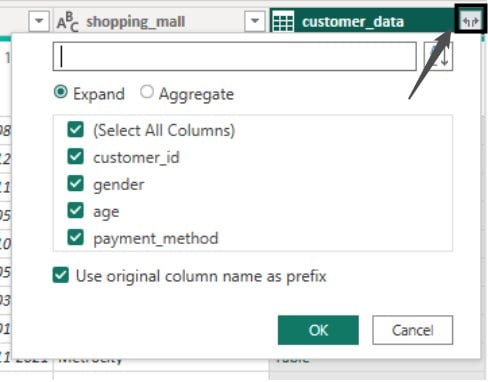
Step 5: Click on the Expand icon (next to customer_data) and choose the list of columns you want to show in the merged table. Click on OK.
You will see the chosen columns in the merged table.

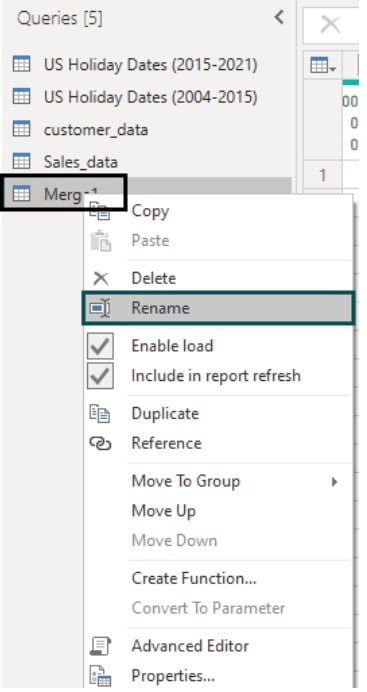
Step 6: Rename the merged table with a valid name.
Step 7: Once the changes are done, click on Close & Apply to save the changes.

Power BI will close the Power Query Editor window and will navigate you back to the Power BI screen. You can see the newly created table in the Data pane in Power BI.

Example #4 – Two tables with filter
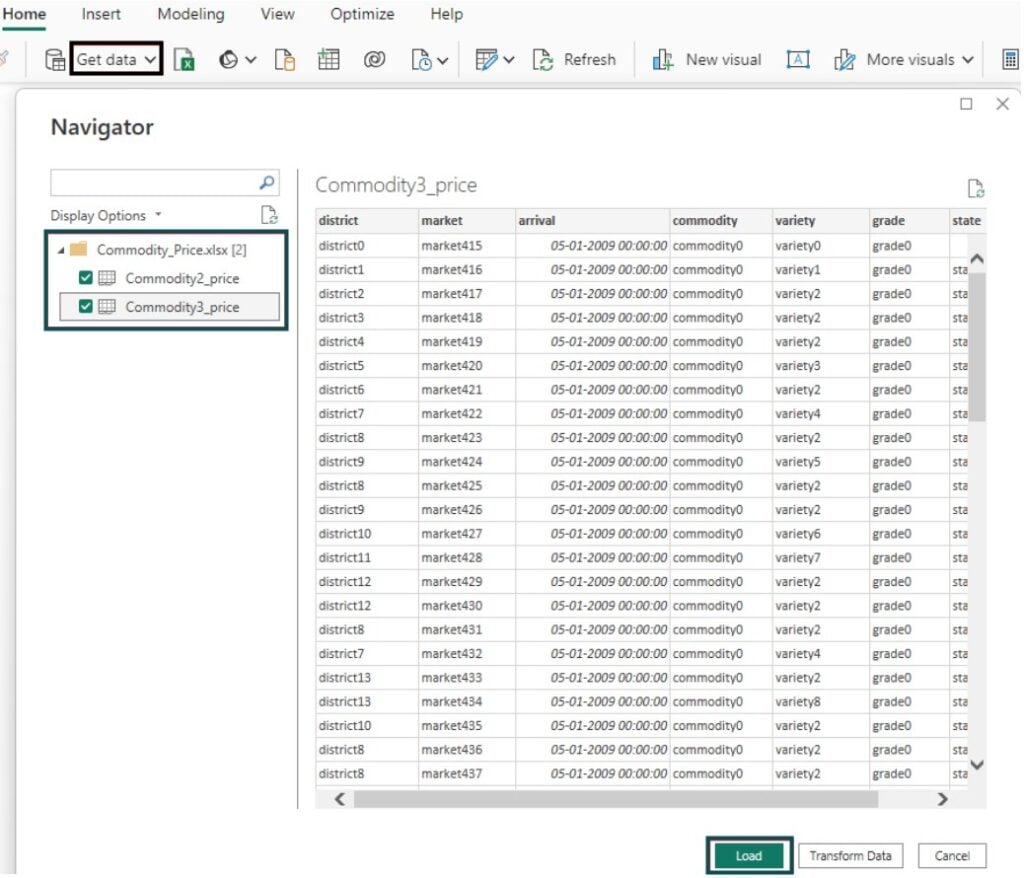
In the last example, we will see Power BI union and filter, i.e., how you can join two tables with a filter condition in Power BI. We will use. For this purpose, we have used the commodity2_price and commodity3_price dataset. These datasets contain different commodity price details.
Follow the steps highlighted below to demonstrate the Power BI union and filter:
Step 1: Import the dataset into Power BI using the steps highlighted in previous examples.
Step 2: Navigate to the Modeling tab, and select the New table option.

Step 3: Use the DAX expression to specify the logic for creating a table from the two tables by selecting the specific columns and applying filters on the combined dataset.
Commodity Price with Filter = FILTER(
UNION(
SELECTCOLUMNS(Commodity2_price, “District”,Commodity2_price[district], “Market”, Commodity2_price[market], “Arrival”, Commodity2_price[arrival], “Commodity”, Commodity2_price[commodity], “Grade”, Commodity2_price[grade], “State”, Commodity2_price[state]),
SELECTCOLUMNS(Commodity3_price, “District”,Commodity3_price[district], “Market”, Commodity3_price[market], “Arrival”, Commodity3_price[arrival], “Commodity”, Commodity3_price[commodity], “Grade”, Commodity3_price[grade], “State”, Commodity3_price[state])
),
[Grade] = “grade0”
)

Step 4: Navigate to the Table view to view the newly created table. As you can see, the commodity data specific to grade 0 is loaded into the output table.

Important Things to Note
- The Power BI Union function works for those table expressions that have the same number of columns.
- Columns join the rows as per their positions in the table expressions. The final output table will have column names as per the table_expression1
- The Power BI Union function retains the duplicate rows. If the column names are positioned differently across the table expressions, then the Power BI Union function will not create any data lineage in the final output table. The data lineage will only be created for the columns that have the exact positioning across the table expressions.
- For the columns differing in data types, the resultant data type in the final table will be based on the rules applicable to data type coercion.
- If there are any related tables for your table expression, the final output table will not contain any columns from those related tables.
Frequently Asked Questions (FAQs)
The key differences between the Union and Merge or Append in Power BI are highlighted below:
No, by default, Power BI union removing duplicates is not possible. It retains duplicate values from all the table expressions.
No, the Power BI Union function does not preserve the order of rows. The order of rows in the final output table may change; a lot of the stacking is dependent on the internal processing of the table rows in Power BI.
No, you can’t union tables with different column names in Power BI. However, if the data types are different, Power BI Union applies rules for data type coercion.
Recommended Articles
Guide to Power BI Union. Here we explain its use cases with examples, syntax, how to use it in Power BI & points to remember. You can learn more from the following articles –

Leave a Reply