What is DAX in Power BI?
DAX (Data Analysis Expressions) is a language used in Power BI tools and other Microsoft applications, such as Power Pivot in Excel. Power BI DAX expressions are used to create calculated tables, calculated columns, and measures in Power BI, used for data analysis and visualization. DAX formulas include functions, operators, and values and are used for complex calculations and data queries in related columns and tables in tabular data models.
For instance, a calculated column refers to adding a new column to an existing table or data model by creating a DAX formula where you can define or map the column’s values. A calculated table creates a new table using the data already loaded into Power BI and using the DAX formula to define the table’s values. Measures represent dynamic calculation formulas used in data reporting and analysis. It allows you to create data aggregation results such as SUM, AVERAGE, MIN, MAX, and COUNT, which can be further used in data analysis.
Following is an example of the Power BI DAX SUMX function to create a calculated column SUMXSales in a table.

Table of contents
Key Takeaways
- Power BI DAX is a powerful formula language for custom calculations and measures.
- Uploading data to Power BI involves connecting to various data source options, choosing tables or data files to import, and loading them into Power BI.
- DAX calculations can be performed using the DAX formula bar or by creating new measures.
- Power BI DAX functions are grouped into categories and can be used for various of data analysis operations.
- Proper data modeling and regular data refreshing are essential for accurate and efficient calculations in Power BI.
📊 Unlock Advanced DAX Skills in Power BI!
Take your Power BI skills to the next level with our Advanced DAX in Power BI Training Course. Dive deep into advanced DAX functions, complex calculations, and optimization techniques to enhance your data analysis and reporting capabilities.
How to Upload Data to Power Bi?
You can upload data to Power BI in multiple ways.
Option 1: When you open the Power BI tool, you will be navigated to the Home tab. Under the Home tab, you will see the multiple data upload options as highlighted below.
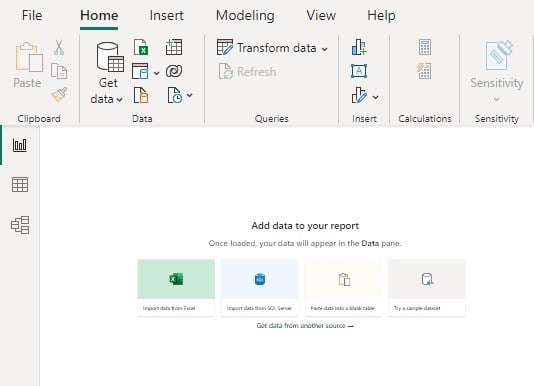
Option 2: Choose from the data sources in the Data group under the Home tab.

To review the complete list of data sources that Power BI support, click on the Get data dropdown followed by the More.. option. You can choose any available options for uploading the data to Power BI.
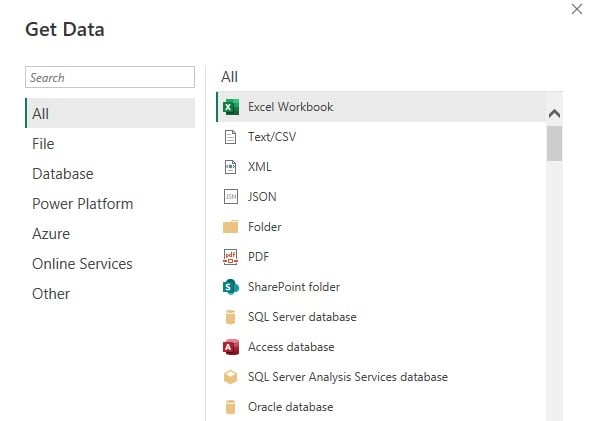
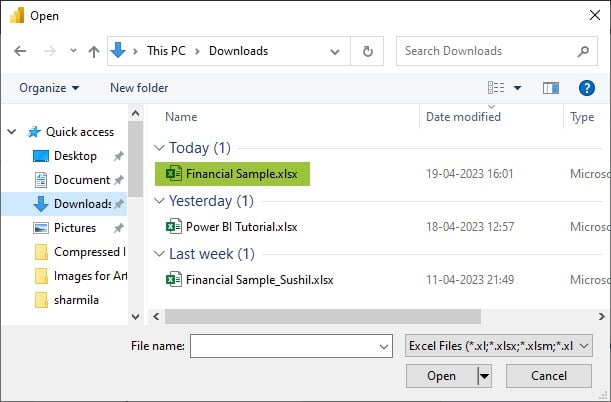
Let us understand this using an example. First, we will upload a Financial sample file(Excel Workbook) in Power BI using the following steps below:
Step 1: Click on the Get data dropdown under the Home tab.
Step 2: Select the Excel Workbook option.
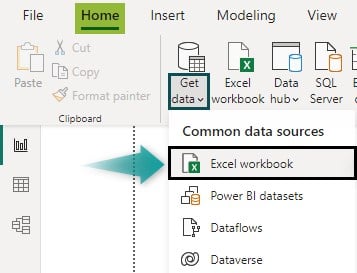
Step 3: Navigate to the file location and select the appropriate file.
Step 4: Power BI will open a Navigator screen with a display option. Select the correct file to preview the dataset.
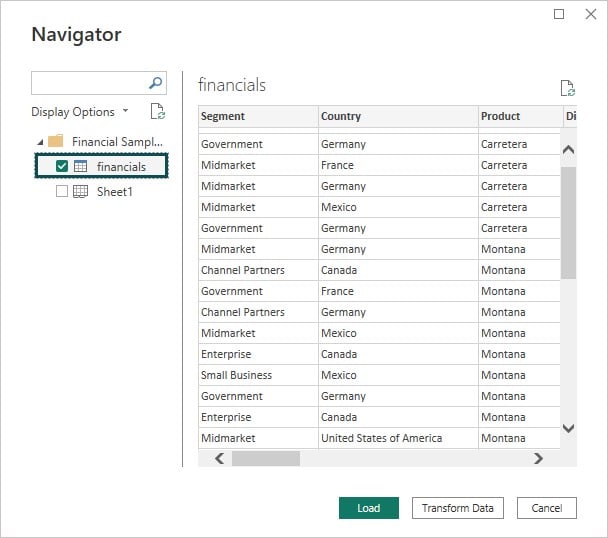
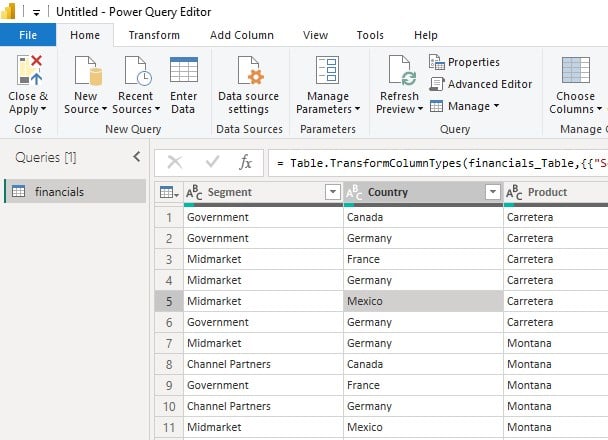
Step 5: Click on the Transform Data button. The dataset will open in a new window i.e., the Power Query Editor tool window.
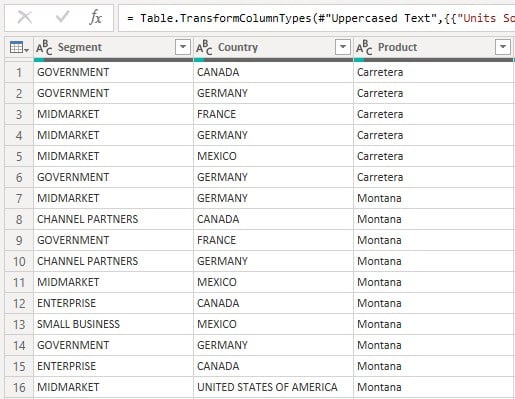
Step 6: Format the dataset. Here, we have formatted the Country and Segment columns to UPPERCASE and changed the data type of “Units Sold” and “Gross Sales” to Whole Numbers.
Step 7: Navigate to the Home tab and choose the Close & Apply option.
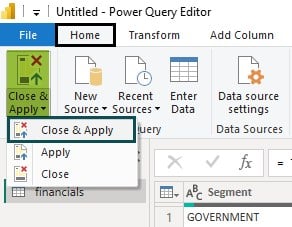
The system will save the changes and close the Power Query Excel Editor window. Finally, power BI will load the updated dataset, and you can see all the columns in Model View.
How to Do DAX Calculation in Power BI?
To perform the Power BI DAX calculation, follow the steps mentioned below.
Step 1: Open Power BI Desktop.
Step 2: Import the dataset to Power BI and apply data transformation (if applicable).
Step 3: Navigate to the Modelling tab.
Step 4: Now choose one of the options i.e., New measure, Quick measure, New column, or New table available in the Calculations group.
Let us understand each of these options through some examples below.
New Column or Calculated Column
The column Profit Percentage is a calculated column representing the Profit as a percentage of the Sales.

This column is created using a DAX formula in Power BI with the steps highlighted below:
Step 1: Go to the Modelling tab.
Step 2: Select the New column option in the Calculations group.

Step 3:
- Define the new column.
- Specify the DAX formula for populating the values.
- Click on the Commit button to save the details.

Step 4: Once the column is created, it will be visible in the Model view.

Click on the Data view to see the values of this calculated column for each record.

Calculated Table or New Table
The table financials country is a calculated table that stores a unique list of countries from the entire dataset. This table is created using the New table feature in Power BI using the steps highlighted below:
Step 1: Go to the Modelling tab.
Step 2: Select the New table option in the Calculations group.
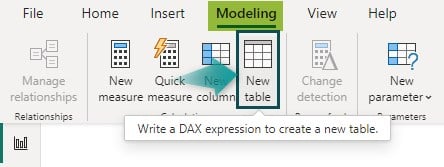
Step 3: Define the new table, specify the Power BI DAX formula for populating the values, and click the Commit button to save the details.
Here we are creating a table of a unique list of countries listed in the dataset.

Step 4: Once the table is created, it will be visible in the Model view.

The calculated table will also be visible in the Data view.

Measures or New Measure
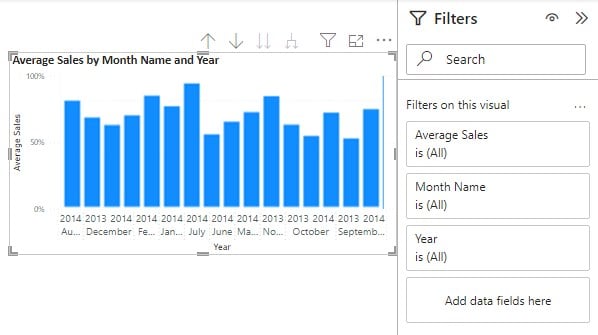
Average Sales is a measure that represents the average of all the sales that occurred across the years. This measure is created using the New measure feature in Power BI using the steps highlighted below:
The steps used to create a new measure are as follows:
Step 1: Go to the Modelling tab.
Step 2: Select the New measure option in the Calculations group.

Step 3: Define the new measure using the DAX formula and save using the Commit button.

Step 4: Once the table is created, it will be visible in the Model view.
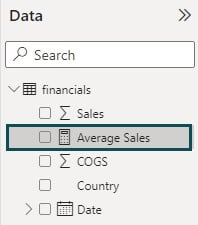
Step 5: Drag the new measure into the chart to create an interactive dashboard in Power BI
Note: There is also an option for creating quick measures. Using this option, you can choose from a predefined list of measures from the Calculation drop-down.
Functions in DAX Power BI
Functions in Power BI DAX can help you create complex and advanced formulas to further use for performing calculations in Power BI. Functions accept arguments such as text value, numbers, date, references, or other functions, etc., in a specific order or format. The different categories of functions include:
- Aggregate Functions
- Date and time functions
- These functions calculate the date and time values, such as the difference between two dates, etc. They include CALENDAR, DATE function, DATEDIFF, WEEKDAY, and YEAR.
- Filter functions
- These functions perform look-up values in related tables, return specific data types and then filter the values. They include: FILTER, CALCULATE, INDEX, LOOKUPVALUE, and SELECTEDVALUE.
- For example, Power BI DAX Lookupvalue (LOOKUPVALUE) retrieves a single value from a table that matches a specific set of criteria.
- Financial functions
- Logical functions
- These functions evaluate a logical expression and allow you to create conditional results. They include AND, IF, NOT, OR, and SWITCH excel function.
- For example, Power BI DAX Switch (SWITCH) is used to evaluate a list of conditions and return a corresponding value for the first true condition.
- Math and Trig functions
- Time-Intelligent functions
- These functions assist you in performing data manipulation operations using periods and help build and compare datasets over these periods. They include CLOSINGBALANCEMONTH, DATEADD, FIRSTDATE, LASTDATE, and PREVIOUSYEAR
- Text functions
- These functions perform string or text-based calculations such as string concatenation, text length, converting the letters into uppercase, etc. They include CONCATENATE, EXACT, FIND, LEN, and UPPER.
- Statistical functions
- These functions perform statistical distribution and probability-related calculations such as Median, Normal Distribution, Geometric Mean, Standard Deviation, etc. They include GEOMEAN, MEDIAN, NORM.DIST, STDEV.P, and VAR.P.
- Parent and Child functions
- These functions can assist in managing data set up as a parent-child hierarchy in a data model. They include PATH, PATHCONTAINS, PATHITEM, PATHITEMREVERSE, and PATHLENGTH
- Other functions
- These functions do not cover any of the standard category functions and perform very unique operations. They include BLANK, ERROR, TOCSV, and TOJSON.
- New functions
DAX functions are similar to the ones used in Microsoft Excel. However, they differ from Excel in many ways, as mentioned below
- Unlike Excel ones, DAX functions don’t refer to a single cell or column reference in a column. Instead, they refer to an entire column or a table to perform data operations or look-ups
- By default, the DAX functions perform operations across all the records or rows in a table. However, single-row-specific functions can be used to restrict the operation to individual rows.
- DAX has specific functions that enable you to perform dynamic calculations based on date ranges.
Important Things to Note
- DAX is case-sensitive, so be careful when typing in functions and calculations.
- Understand data modeling, DAX, and other technical concepts to ensure accurate and efficient calculations.
- Refresh your data regularly to keep your visualizations up to date.
- You can collaborate and share the reports and dashboards within the organization and with external customers in Power BI.

Frequently Asked Questions (FAQs)
You can use the DIVIDE function to calculate the percentage in Power BI DAX.The DIVIDE function takes two arguments: the numerator and the denominator.
Here’s an example of calculating a percentage using DAX:
Percentage = DIVIDE(financials[COGS],financials[ Sales])*100
You can filter a column using the FILTER function in DAX.
The FILTER function filters a table based on a Boolean expression.
Here’s an example of creating a table using the filter option:
Step 1: Navigate to the Modelling tab and select the New table option
Step 2: Create a DAX formula using the Filter function to create a table from the financials table by choosing only those records where the country is GERMANY
A new table FilteredTable is now created with all the columns from the financials table and has only those records where the country is GERMANY
Model View
Data View
You can use the DISTINCT function to remove duplicates in Power BI DAX. The DISTINCT function returns a table with unique values.
In the example below, we have created a column financials country to store a unique list of countries available in the financials dataset.
You can see unique country names are stored in this column.
There are two options to add comments in Power BI DAX.
Option 1: Use two forward slashes (//) to indicate a single-line comment
// This is a single-line comment
Option 2: Use a forward slash followed by an asterisk (/*) to indicate a multi-line comment
/*
This is a multi-line comment
Enter as many lines as you like
*/
Recommended Articles
Guide to Power BI DAX. Here we explain how to upload data file and do DAX calculation in Power BI with examples. You can learn more from the following articles –

Leave a Reply