
What Is LOG Function In Excel?
The LOG function in Excel is an inbuilt Math & Trig function. It determines the logarithm of a given number to the specified base.
Users can apply the LOG Excel function in finance and statistics domains for tasks such as long-term perspective analysis of rate variations and regression analysis. And the function helps solve logarithmic equations in Excel.
Download FREE LOG Excel Function Template and Follow Along!Use this LOG Excel Function Template to follow along with the examples in this article.
Download Excel TemplateFor example, the below table shows a set of numbers and corresponding base values, as per the given description statements, to determine the log of the specified numbers.

And suppose the requirement is to display the calculated log values in column D. Then, as per the LOG Excel function meaning explained above, we can apply the LOG() in the target cells and get the required data.

In the above LOG Excel function example, all the target cells’ formulas take two arguments, except in cell D4. The reason is that the default value of the base argument in the LOG Excel function is 10. And so, we can ignore the argument in this case.
Further, as per the logic, raising the base to the power of the LOG() return value will result in the given number.
For example, the LOG function output in cell D2 is 2. And if we raise the specified base value of 11 to power 2, the result is 121, which is the given number.
Thus, we can represent the above statements as:
Log11(121) = 2
And it implies,
112 = 121
Key Takeaways
- The LOG Excel function calculates the logarithm of a number to the specified base. And the function output is the exponent, the value to which raising the base will result in the given number.
- Users can use the LOG() to solve logarithmic equations. And the function is useful in statistics and the financial domain for performing activities such as regression analysis and plotting graphs to represent rapidly changing prices.
- The LOG function accepts one mandatory argument, number, and an optional argument, base, as input.
- We can use the LOG() with other Excel functions, such as POWER and IF, to achieve fruitful results.
LOG() Excel Formula
The LOG Excel function syntax is:

where,
- number: The number we require to determine the logarithm for using the LOG Excel function.
- base: The logarithm’s base value.
While the first argument is mandatory, the second one is optional. And if we choose to ignore the second argument, the LOG() assumes the default base value, 10.
Further, adhering to the below points will help us avoid the condition of the LOG Excel function not working.
- The number argument value should be a positive real number.
- If any of the supplied LOG Excel function arguments are negative or zero, the LOG function will throw the #NUM! error.
- If the provided base value is 1, the LOG function output will be the #DIV/0! error.
- If any of the provided LOG Excel function arguments are not numbers, the LOG() returns #VALUE! error.
How To Use LOG Excel Function?
The steps to use the LOG Excel Function are as follows:
- First, check whether the value we require the logarithm for is a positive real number. And ensure the specified base value is not 0, 1, a negative number, or non-numeric.
- Then, select the required target cell, and enter the LOG Excel function.
- Finally, press Enter to view the logarithm of the given number.
The following example clearly explains the steps mentioned above to ensure we avoid facing the scenario of the LOG Excel function not working.
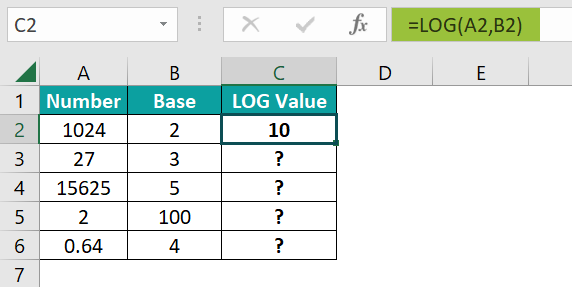
The table below contains a list of numbers and the corresponding base values.

And suppose the requirement is to compute the logarithm of each given number to the specified base and display the result in the respective column C cells. Then, applying the LOG function in the target cells will fetch us the required logarithm values.
- First, select the target cell C2, enter the LOG(), and then, press Enter.
=LOG(A2,B2)

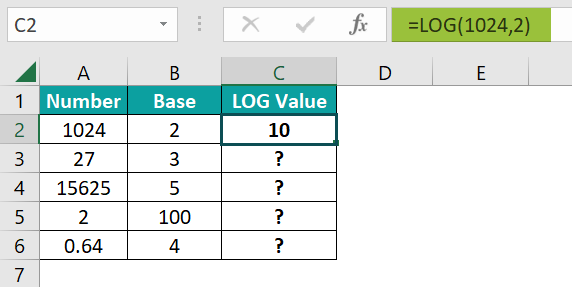
We can also directly supply the two number values as the LOG() arguments.
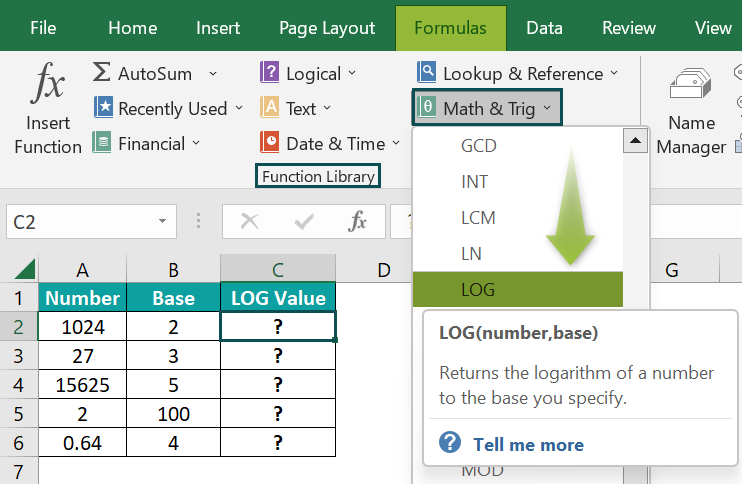
Alternatively, we can select the target cell and go to Formulas → Math & Trig → LOG to open the Function Arguments window and enter the LOG() arguments.

After we fill in the argument fields in the Function Arguments window, click OK, and the LOG() will get executed in the target cell.
Entering the numbers directly in the fields, instead of the cell references to numbers, will also give the same result. - Next, use the fill handle, and then, copy the formula in cell range C3:C6.

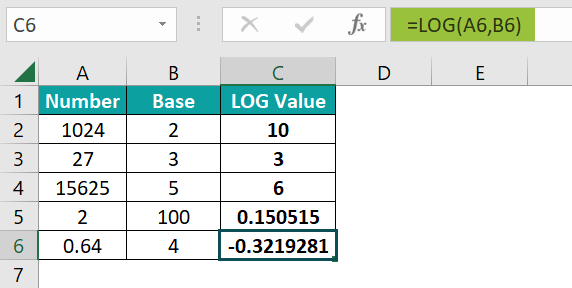
Let us consider the cell C6 formula to see how the formula executes. The LOG() takes the values 0.64 and 4 as the number and base argument values. It then returns the logarithm of 0.64 to base 4, -0.3219281. The result is negative because the given number is a decimal.


Examples
Check out the below examples to understand the LOG Excel function meaning and apply the function effectively.
Example #1
We shall see how to use the LOG Excel function while performing logarithmic regression analysis.
Consider the first table contains a child’s age-wise weight data.

Suppose we need to conduct a logarithmic regression analysis with the given data. Then the steps are as follows:
First, we will create a scatter plot to get the logarithmic trendline and the regression formula for the above data.
- Step 1: To begin with, select the cell range A1:B11, and then, click Insert → Scatter (X, Y) → Scatter to create a Scatter plot.


- Step 2: Next, click the chart area to access the Chart Elements option and enable the Axis Titles and Trendline options.

- Step 3: Then, update the chart title and axis titles by clicking the respective elements in the chart area.

- Step 4: Next, right-click the horizontal axis and choose Format Axis in the contextual menu to open the Format Axis pane. And set the Major units as 1.0.


Thus, now we can see every age value in the horizontal axis.
- Step 5: Right-click the trendline and select Format Trendline in the contextual menu to open the Format Trendline pane.

- Step 6: Next, select the Logarithmic trendline and the option to show the trendline equation.


And thus, the final chart will appear as depicted below:

Now, we shall use the LOG Excel function in the second table while performing the logarithmic regression analysis based on the equation obtained from the plot.
Suppose we need to predict the weight at the age of 7.5 years. Then, the steps are as follows:
- Step 7: We shall fill in the parameter values in the second table.
As the age is 7.5 years, x will take this value in cell L3.

As the trendline equation uses the LN excel function, which returns the natural logarithm of a given number, we can apply the LOG() and get the equivalent formula in cell L4.
=LOG(L3,EXP(1))

And we can get the a and b values from the trendline equation and enter them in cells L5:L6.

- Step 8: Enter the values (determined in step 7) in the logarithmic regression formula to get the predicted weight at 7.5 years in cell L8.
=L6*L4+L5

Thus, the predicted weight at the age of 7.5 years is 59.547 lb. And we get the same value in the plot, as highlighted below.

Thus, we use the LOG() to determine the logarithm of the given x value in the logarithmic regression analysis.
Example #2
This LOG Excel function example shows how to use it with POWER().
The below table contains two input value sets.

Suppose the requirement is to determine the logarithm of the number obtained by raising the given base to the exponent and display the results in cell range B5:B6 for the two input sets.
Then, we can use the LOG() and POWER Excel function in the target cells and get the required logarithm values.
- Step 1: First, select the target cell B5, enter the below formula, and then, press Enter.
=LOG(POWER(B2,B3))

First, the POWER() raises the given base, 10, to the power of 6, thus returning the value 1000000. Next, the LOG() considers 1000000 as the number argument. And as the base has the default value, 10, the function omits it.
So, the LOG() returns the logarithm of 1000000 to the base 10 as 6, the same as the given exponent value.
- Step 2: Next, select the target cell B6, enter the below formula, and then press Enter.
=LOG(POWER(C2,C3),C2)

The POWER() raises the base 3 to the power of 4 to return the value 81. Then, the LOG() accepts the POWER() output and the given base value as the two required arguments. And thus, it determines the logarithm of 81 to the base 3 as 4.
Example #3
Let us see how to apply the LOG Excel function to measure loudness in decibels (dB).
The equation to determine loudness is:

where,
- L(Ⅰ): Loudness in dB
- Ⅰ: Sound intensity in W/m2
- Ⅰo: The human hearing threshold
For example, the below table contains the values of the parameters mentioned above.

Suppose the requirement is to determine the loudness in dB, based on the given sound intensity, I, and display the result in cell B6. Then, we can apply the LOG Excel function in the target cell and get the required data.
- Step 1: To begin with, select the target cell B6, enter the below formula, and then, press Enter.
=10*LOG(B2/B3)

In this example, the LOG() takes only one argument, number, and omits the second argument, base. The reason is that according to the mathematical expression, the base is 10, the default value the LOG() takes.
So the LOG() returns the logarithm of the value (400/10-12) to the base 10, 14.60205999. And finally, the formula multiplies the LOG() output by 10 to give the output 146.0205999 dB as the loudness level.
Important Things to Note
- Ensure the number argument is a positive real number.
- The LOG Excel function considers 10 as the default value of the base argument if omitted.
- For negative or zero as the LOG() arguments, the function returns the #NUM! error.
- For non-numeric arguments, the LOG function output will be the #VALUE! error.
- For a base value of 1, the LOG function throws the #DIV/0! error.
Frequently Asked Questions (FAQs)
We can apply the LOG function in Excel VBA using the below method:
Application.WorksheetFunction.Log(number,base)
The arguments in the above method have the same interpretation as the LOG() arguments explained in the LOG() Excel Formula section.
Let us see an example of how to use the above method in Excel VBA.
The below table contains a list of numbers and base values.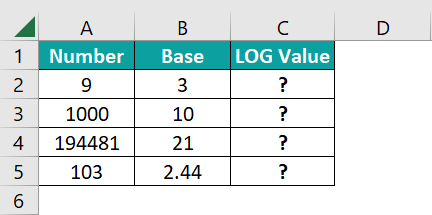
Suppose we need to determine the logarithm of the given numbers to the corresponding base values and display the output in column C. Then, here is how we can use the method mentioned above in Excel VBA to apply the LOG function in the target cells.
• Step 1: With the active worksheet open, press Alt + F11 to access the VBA Editor.
• Step 2: Next, click the required VBAProject and then, select Module under the Insert tab to open a new module window, Module1.
• Step 3: Then, enter the VBA code to apply the LOG function in the target cells.
Sub LOG_fn()
Range(“C2”) = Application.WorksheetFunction.Log(Range(“A2”), Range(“B2”))
Range(“C3”) = Application.WorksheetFunction.Log(Range(“A3”), Range(“B3”))
Range(“C4”) = Application.WorksheetFunction.Log(Range(“A4”), Range(“B4”))
Range(“C5”) = Application.WorksheetFunction.Log(Range(“A5”), Range(“B5”))
End Sub
• Step 4: Click the Run Sub/UserForm button to run the code.
• Step 5: Open the active sheet to view the results in the target cells.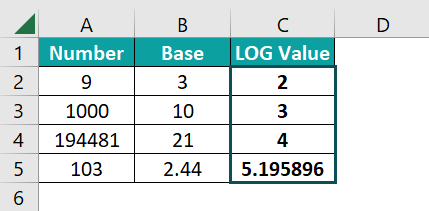
Let us consider the formula applied to cell C5. The method accepts the given number and base, 103 and 2.44, as input. It then determines the logarithm of 103 to the base 2.44 as 5.195896.
The difference between the LOG, LN, and LOG10 functions is that the LOG() computes the logarithm of the given number to the specified base. On the other hand, the LN() and LOG10() determine a given number’s natural and base-10 logarithm, respectively.
We can use the LOG function in Excel in the following scenarios:
• Business Analytics: For performing regression analysis and creating charts to represent the data with a rapid rate of change graphically.
• Mathematical Applications: To solve logarithmic equations.
Use this LOG Excel Function Template to follow along with the examples in this article.
Download Excel Template