
What Is Lognormal Distribution In Excel?
The Lognormal Distribution in Excel gives the distribution of a variable with a normally distributed logarithm with parameters mean and standard deviation. We can use the function to review logarithmically transformed data, like the long-term return on a stock and share prices.
The Excel Lognormal Distribution is an inbuilt Statistical function LOGNORM.DIST(), so we can insert the formula from the “Function Library” or enter it directly in the worksheet.
Use this Lognormal Distribution In Excel Template to follow along with the examples in this article.
Download Excel TemplateFor example, the below table contains the value, x, and we must determine the Lognormal Distribution. Also included are the mean and the standard deviation of the ln(x).

Enter the formulas =LOGNORM.DIST(B2,B3,B4,TRUE) in cell B7, and =LOGNORM.DIST(B2,B3,B4,FALSE) in cell B8, and press the “Enter” key.

The output is shown in the above image. The LOGNORM.DIST function in the two target cells accepts the given data as the first three arguments. But the last argument’s value in each target cell formula changes based on the required function form, cumulative distribution function, and probability density function.
Key Takeaways
- The Lognormal Distribution in Excel, i.e., LOGNORM.DIST(), determines the distribution of a given value with a normally distributed logarithm. And the logarithm of the specified value is normally distributed with the mean value and standard deviation.
- Users can use the LOGNORM.DIST() to analyze logarithmically transformed data in the finance, real estate, and medical domains.
- The LOGNORM.DIST function accepts four mandatory arguments, x, mean, standard_dev, and cumulative, as inputs. And the argument cumulative decides whether the distribution type is cumulative distribution function or probability density function.
- We can use the function to create the lognormal cumulative distribution and lognormal probability density function plots for the given x values.
LOGNORM.DIST() Excel Formula
The syntax of the LOGNORM.DIST Excel formula is,

The mandatory arguments of the LOGNORM.DIST Excel formula are,
- x: The value at which we require to assess the function.
- mean: The ln(x)’s mean.
- standard_dev: The ln(x)’s standard deviation.
- cumulative: A logical value that indicates the distribution type or function form. The LOGNORM.DIST() output is the cumulative distribution function if the argument value is TRUE. And for an argument value of FALSE, the function output is the probability density function.
How To Calculate Lognormal Distribution In Excel?
We can calculate the Lognormal Distribution in 2 ways, namely,
- Access from the Excel ribbon.
- Enter in the worksheet manually.
Method #1 – Access from the Excel ribbon
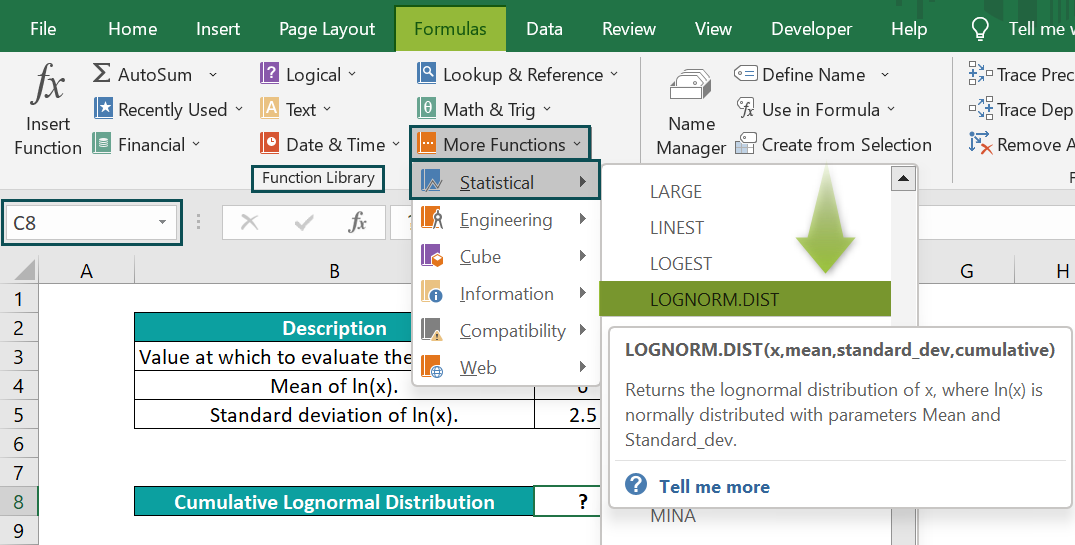
Choose a target cell for output → select the “Formulas” tab → go to the “Function Library” group → click the “More Functions…” option drop-down → click the “Statistical” option right arrow → select the “LOGNORM.DIST” function, as shown below.

The Function Arguments window appears. Enter the arguments in the “X, Mean, Standard_dev, and Cumulative” fields → click “OK”, as depicted below.

Method #2 – Enter in the worksheet manually
- Choose a target cell for the output.
- Type =LOGNORM.DIST( in the cell. [Alternatively, type =L or =LOG and double-click the LOGNORM.DIST function from the Excel suggestions.]
- Enter the mandatory arguments as cell values or references and close the brackets.
- Press Enter to execute and get the required Lognormal Distribution of the given value.
Let us see a Lognormal Distribution in Excel example to understand the function.
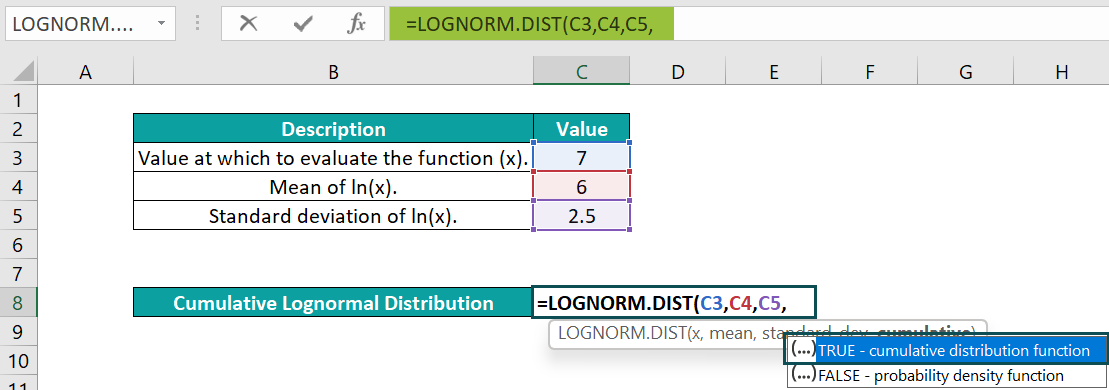
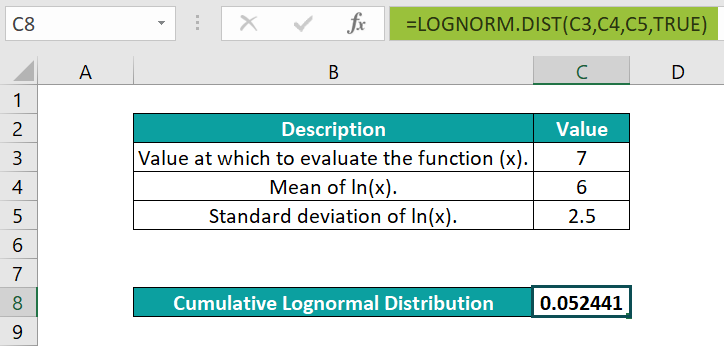
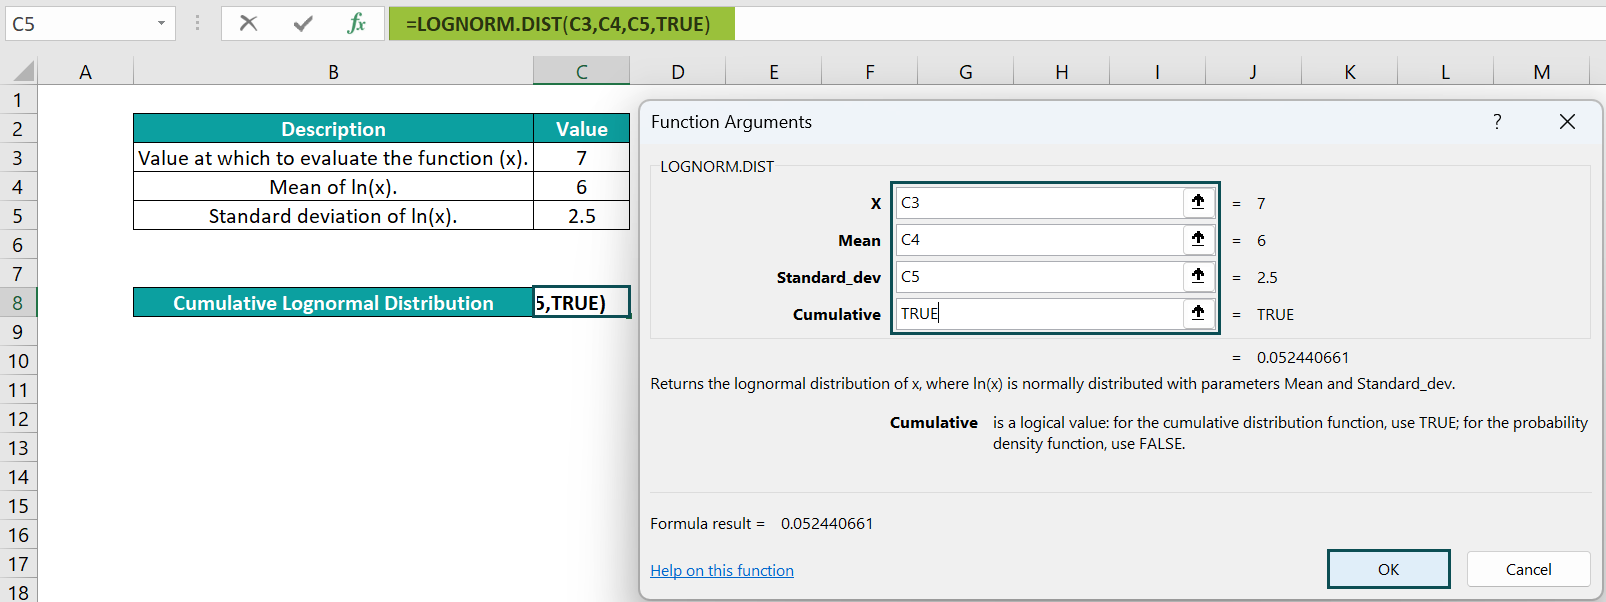
The below table contains a value x, the mean, and the standard deviation of its logarithm. And we will determine the cumulative Lognormal Distribution at the specified value of 7.

The steps to apply the LOGNORM.DIST formula are,
- Select cell C8, and enter the formula =LOGNORM.DIST(C3,C4,C5,

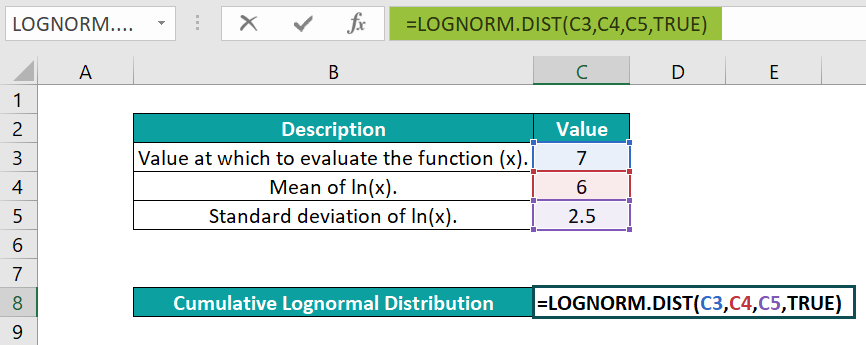
- Once we enter the third argument and a comma (‘,’), Excel will show a drop-down list of logical values to choose as the fourth argument value. Double-click the required option and type the closing bracket to complete the formula. And as we require the cumulative Lognormal Distribution at 7, we shall pick TRUE. Then, the complete formula is =LOGNORM.DIST(C3,C4,C5,TRUE)

- Press “Enter”. The result is “0.052441”, as shown below.

[Alternatively, select the target cell C8, and go to Formulas → More Functions → Statistical → LOGNORM.DIST to apply the function in the chosen cell.
The above step will open the Function Arguments window.
Next, enter the given cell values or references in the fields in the Function Arguments window.
Finally, clicking OK will close the window. And we will see the LOGNORM.DIST() output in the target cell C8.]
Thus, at the given value of 7, the mean and standard deviation of its logarithm, the LOGNORM.DIST() returns the cumulative Lognormal Distribution of 0.052441.
Examples
We will consider some advanced scenarios using the LOGNORM.DIST() examples.
Example #1
The below image has the mean and standard deviation of its logarithm. We will determine the probability Lognormal Distribution at 9 using the LOGNORM.DIST() function.

The procedure to apply the LOGNORM.DIST() formula is,
Select cell E8, enter the formula =LOGNORM.DIST(E3,E4,E5,E6), and press Enter.

The LOGNORM.DIST() accepts the value of 9, its logarithm’s mean and standard deviation, and the cumulative value of FALSE. And it returns the probability Lognormal Distribution at 9 as 0.003098.
Example #2
The lognormal cumulative distribution function equation is as follows:

The arguments x, µ, and o, are the given value, the mean and standard deviation of its logarithm. As the distribution function is cumulative, the cumulative argument value in the two functions will be TRUE.
For example, the below table contains the inputs required to determine the cumulative Lognormal Distribution of the given value, x.

The steps to apply the LOGNORM.DIST() and its equation using the NORM.S.DIST() are,
- Step 1: Select cell E7, enter the formula =LOGNORM.DIST(E3,E4,E5,TRUE), and press Enter.
The result is “0.019558”, as shown below.

- Step 2: Select cell E8, enter the formula=NORM.S.DIST((LN(E3)-E4)/E5,TRUE), and press Enter.
The result is “0.019558”, as shown below.

The above formula determines the natural logarithm of the given value of x, 6.802395. Next, it subtracts the mean value of 10 from 6.802395 to give the difference of -3.19761. And then, the formula divides the value by the given standard deviation of 1.55 to return the value of -2.06297.
Finally, the NORM.S.DIST() accepts -2.06297 as its argument z value. And it returns the cumulative distribution function as 0.019558, which is the same as the LOGNORM.DIST() output.
Example #3
The image below shows two tables. And both contain the same list of x values. We will plot a Lognormal Distribution in Excel for the given set of x values, with the distribution type being the probability density function. In other words, we need to plot a probability Lognormal Distribution.

The steps to plot a Lognormal Distribution in Excel are,
- Step 1: Select cell C2, enter the formula =LN(B2), and press Enter.

- Step 2: Using the excel fill handle, drag the formula from cell C2 to C12, as shown below.

- Step 3: Select cell C14, enter the formula =SUM(C2:C12)/11, and press Enter.

- Step 4: Select cell C15, enter the formula =STDEV.S(C2:C12), and press Enter.

- Step 5: Select cell F2, enter the formula =LOGNORM.DIST(E2,$C$14,$C$15,FALSE), and press Enter.

- Step 6: Using the fill handle, drag the formula from cell F2 to F12.

- Step 7: Click on a cell in the range E1:F12, and follow the path Insert → Scatter or Bubble Chart → Scatter with Smooth Lines.

When we click the highlighted chart type, the following graph is generated.

- Step 8: Click the Chart Elements option (‘+’ icon), and check the Axis Titles box.

- Step 9: Update the chart and axis titles by double-clicking the respective elements in the chart area, one at a time.


Thus, the final probability Lognormal Distribution plot will be:

First, we find the natural logarithm of each x value. Next, we find the mean value and the standard deviation of the determined ln(x) values.
And then, we calculate the probability Lognormal Distribution at each x value using the LOGNORM.DIST().
Finally, for the given x values and determined probability Lognormal Distribution values, we plot a Scatter chart to obtain the required Lognormal Distribution curve.
Important Things To Note
- The LOGNORM.DIST() function truncates all the specified numeric values to integers.
- When any of the given argument values are non-numeric, we will get the #VALUE! error.
- We get the #NUM! error if the given x or standard_dev equals or is less than zero.
- The LOGNORM.DIST function is available from Excel 2010 version. And the equivalent function in the previous Excel versions is LOGNORMDIST.
Frequently Asked Questions (FAQs)
The LOGNORM.DIST function in Excel is in the Formulas tab.
Select a target cell, and follow the path Formulas → More Functions → Statistical → LOGNORM.DIST to insert the function, as shown below.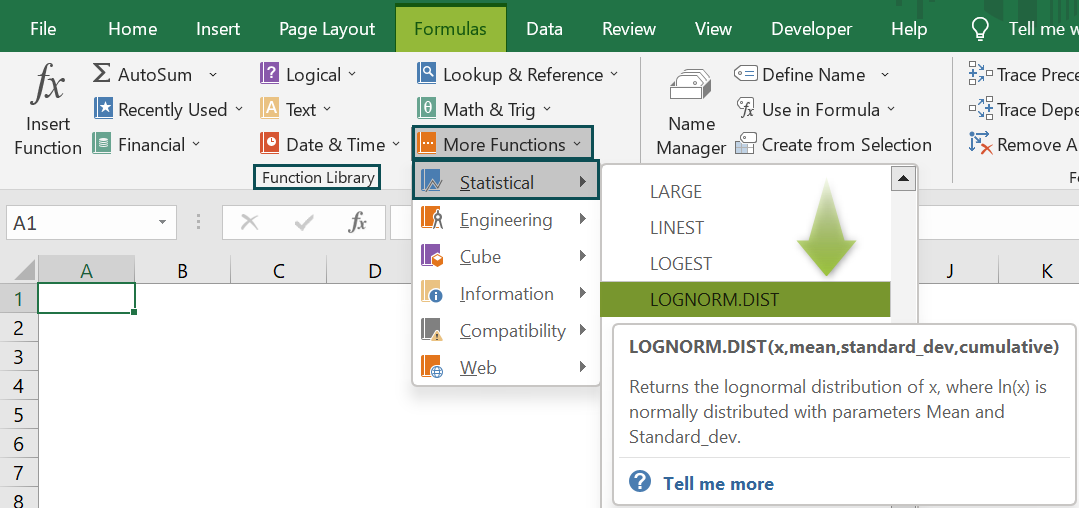
We can apply Lognormal Distribution in Excel VBA using the below method:
Application.WorksheetFunction.LogNorm_Dist(Arg1, Arg2, Arg3, Arg4)
The four arguments in the above method have the same definition given in the LOGNORM.Dist() Excel Formula section of the above article.
For example, the below table contains a value, x, and the mean and standard deviation of ln(x). We will determine the cumulative and probability Lognormal Distributions at the specified value of x, 5.48.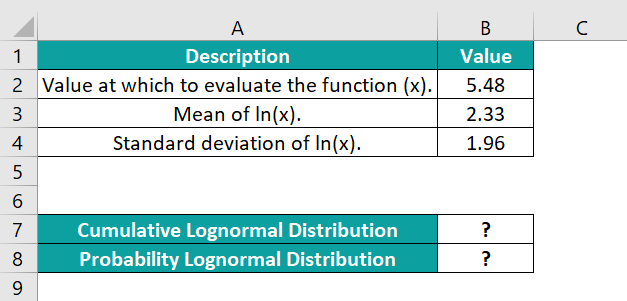
The steps to use Lognormal Distribution in Excel VBA are,
• Step 1: In the worksheet containing the above table open, access the VBA Editor using Alt + F11.
• Step 2: Select the required VBAProject and pick the Module option under the Insert tab.
The Module1 window opens.
• Step 3: Type the VBA code, shown below, in the Module1 window to apply the LOGNORM.DIST() in the target cells.
Sub Lognorm_Dist_fn()
Dim ws As Worksheet
Set ws = Worksheets(“LOGNORMAL.DIST_FAQ”)
ws.Range(“B7”) = Application.WorksheetFunction.LogNorm_Dist(ws.Range(“B2”), ws.Range(“B3”), ws.Range(“B4”), True)
ws.Range(“B8”) = Application.WorksheetFunction.LogNorm_Dist(ws.Range(“B2”), ws.Range(“B3”), ws.Range(“B4”), False)
End Sub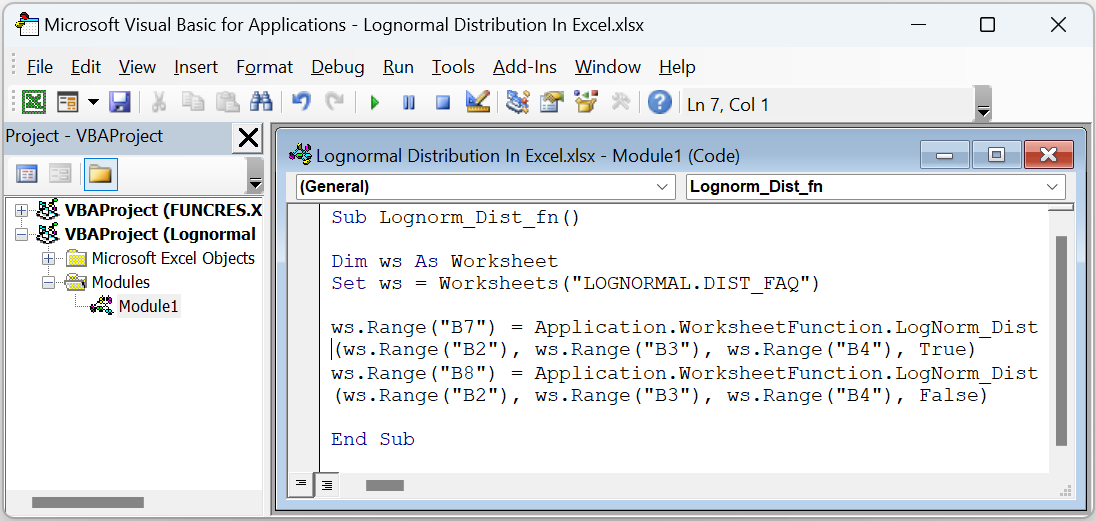
• Step 4: Click the Play button to execute the code.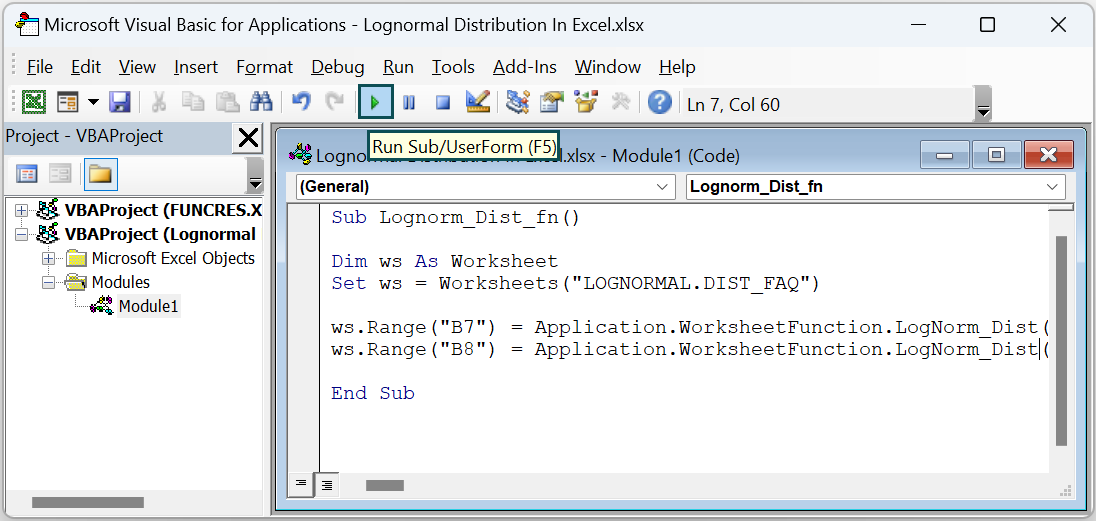
Finally, open the active sheet to view the required distributions in the target cells, as shown below.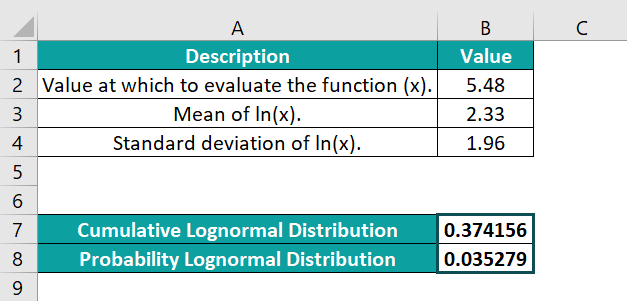
The LOGNORM.DIST function may not work for the following reasons:
• The specified argument values are non-numeric.
• The given x or standard_dev equals or is less than zero.
Use this Lognormal Distribution In Excel Template to follow along with the examples in this article.
Download Excel Template