


Introduction
Finance people often face a simple but frustrating problem: they know a key metric, such as profit, revenue, or headcount, has moved, but they cannot quickly pinpoint which dimension, product, or region is driving the change. Traditional methods such as stacked bar charts, slicer‑driven filters, and ad‑hoc pivot tables force the analyst to guess the hierarchy and manually drill through layers of data. Power BI Decomposition Trees AI root cause analysis changes this. It lets users break down a single measure across multiple dimensions interactively, guided in real time by AI‑driven splits and branch‑suggestions. When combined with the Decomposition Trees root cause visual, analysts can jump from a high‑level number to the exact combination of categories that explains the variance without predefined hierarchies.
This article explains how to use Power BI Decomposition Trees with AI to quickly understand why a metric changed. The visual helps users find the main drivers, spot unusual values, and explore data in an interactive way. Microsoft describes it as an AI‑powered tool for ad‑hoc exploration and root‑cause analysis. For data and finance teams, it means they can get clearer, step‑by‑step answers to the question “Why did this number move?” without leaving the Power BI report.
How the Decomposition Tree Works?
A Decomposition Tree visual in Power BI lets the user pick a single numeric measure, such as Sales, Expenses, or Headcount. It then successively breaks it down by categorical fields such as Region, Product, Segment, or Month. Behind the scenes, Power BI automatically aggregates the measure and re‑partitions it at each level, updating the tree nodes in real time as the user drags fields into the “Find out why” pane or uses the builtin AI‑suggested splits.
Key properties of the visual include:
- AI splits: The tree can recommend the next best dimension to drill into based on the current data, choosing whether to highlight “high values” or “low values” relative to the total.
- Flexible hierarchy: Users can change the order of the drill‑down (for example, Region -> Product vs. Product ->Region) without rebuilding the model.
- Interactive filtering: Other visuals on the page respond to selections inside the tree, linking the root‑cause exploration to wider dashboards.
The underlying logic is similar to recursive breakdown models used in cube‑based analytics, but the decomposition tree wraps it in an intuitive, click‑driven interface. Public Power BI documentation notes that the decomposition tree is an artificial intelligence visualization designed to support ad hoc exploration and root cause analysis, which is why it fits so well for financial and operational diagnostics.
How to Perform AI‑Driven Root Cause Analysis
Using AI powered Power BI Decomposition Trees root cause follows a structured but flexible workflow.
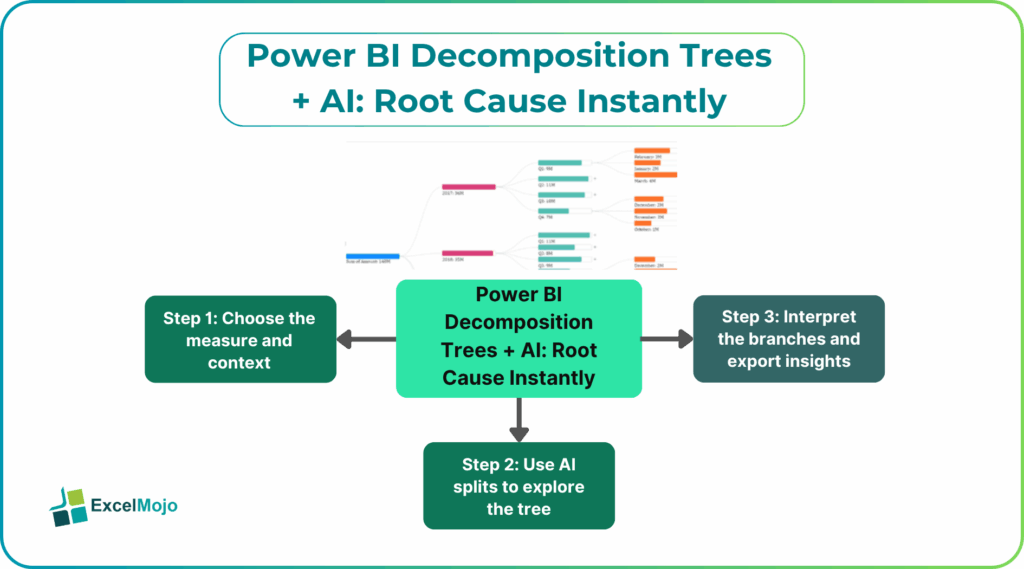
Step 1: Choose the Measure and Context
Start by selecting the card metric or measure that needs explanation, such as a drop in EBIT, a spike in customer churn, or a budget variance. Place that measure into the Decomposition Tree field well and confirm that the underlying model already exposes the relevant dimensions.
Step 2: Use AI Splits to Explore the Tree
Once the tree is loaded, there are two main paths:
- Manual drilling: Drag fields into the “Find out why” pane in the order that aligns with business intuition.
- AI‑assisted drilling: Turn on AI splits and let Power BI propose the next most impactful dimension, then iterate by asking the tree to dig into “High Value” or “Low Value” branches.
The AI‑based suggestions are particularly useful when the user does not have a clear prior hypothesis about which dimension is driving the change. AI splits feature can turn a multi‑step breakdown into a rapid, guided discovery process, especially for professionals who are not deep statisticians.
Step 3: Interpret the Branches and Export Insights
At each level, the tree shows the contribution of each node as a share of the total, and the color‑coding or size‑coding reinforces which branches are outliers. Analysts of Power BI Decomposition Trees AI root cause analysis can then:
- Export the current tree state to PDF or PowerPoint for governance discussions.
- Add a small textual summary next to the tree that narrates the discovered driver in plain language.
This pattern is a practical example of automated root cause analysis Power BI Decomposition Trees and shows how the visual can move from raw data to a structured narrative.
Practical Example: Investigating a Profit Drop
Suppose a finance professional observes a sharp decline in segment‑level profit over the last quarter. Using Power BI Decomposition Trees AI root cause analysis, the process might look like this:
- Load Profit as the measure and the relevant Segment, Region, Product, and Time dimensions into the model.
- Put Profit into a Decomposition Tree visual and use AI splits to ask, “Why is Profit low in this segment?”
- Follow the AI‑suggested branches, which might lead to a specific Region -> Product combination that is dragging the total down.
- Use that insight to create a follow‑up table visual or DAX measure that isolates and forecasts the impact of correcting that segment.
This workflow is a clear example of the Decomposition Tree in action and shows how the AI‑assisted breakdown can turn a manual, multi‑step investigation into a single interactive tree.
Pitfalls and Best Practices
Power BI Decomposition Trees AI root cause analysis is powerful but can mislead if used carelessly.
One common issue is over‑reliance on AI splits. The AI may suggest a statistically prominent branch that is not financially or operationally meaningful. Analysts should combine the tree’s output with business context and, where possible, validate the finding with a simple DAX expression or a separate summary table.
Another risk is dimension overload. Adding too many fields or using high‑cardinality dimensions (e.g., customer ID or transaction ID) can create overly deep trees that are hard to navigate. Best practice is to keep the dimension set focused on the most relevant business attributes and pre‑filter the context (e.g., a specific time window or geography) before starting the decomposition.
A third pitfall in Power BI Decomposition Trees AI root cause analysis is misinterpretation of percentages. The tree normalizes each node relative to the parent, so a small absolute impact can appear as a large percentage share if the parent node is itself small. Users should always cross‑check the tree with actual numeric values in supporting visuals to avoid confusing relative shares with total business impact.
Frequently Asked Questions (FAQs)
Power BI Decomposition Trees AI root cause analysis is best viewed as a complementary, exploratory tool rather than a full replacement for statistical or predictive models. It helps surface hypotheses and identify major drivers, which can then be tested with regression or other advanced techniques.
AI powered Power BI Decomposition Trees root cause focuses on hierarchical breakdown of a single numeric measure, whereas Key Influencers analyze which categorical fields most strongly correlate with a numeric outcome. The two visuals often work well together: the decomposition tree uncovers the composition, and Key Influencers highlight which variables drive that composition.
Automated root cause analysis Decomposition Trees can be safe for production dashboards as long as the underlying model is well‑tested, the dimensions are business‑meaningful, and users are trained to interpret the tree’s suggestions critically. Teams should avoid presenting the tree as a standalone decision rule without additional validation.
Yes, Power BI Decomposition Trees with AI instantly can handle time‑based drivers when time‑related fields such as Month, Quarter, or Week are included as dimensions. The tree will break down the selected measure over time and can highlight specific periods that drive the overall change.
Recommended Articles
Continue with these related resources when you want the next practical step in this topic.
Explore the full Power BI Visuals and Reports guide or browse Power BI Resources.