
Introduction
Power BI reports are often built by finance teams and contain multiple views of the same data like a high‑level K‑PI page, a detailed breakdown by business unit, and a scenario‑analysis tab. Without guidance, users bounce between pages and slicers, missing the logical flow of the story. Power BI bookmarks Copilot dynamic storytelling solves this by using bookmarks to capture predefined report states and layering Copilot‑assisted narrative text over those views. With Power BI bookmarks with Copilot, analysts can turn a static dashboard into an interactive experience that walks stakeholders through key messages step-by-step.
This guide explains how to design Copilot Power BI dynamic reports that use bookmarks as chapters in a data narrative. Readers will see how AI powered Power BI bookmarks automation can generate summary text, suggest visual highlights, and help structure the sequence of views. Recent Power BI and Copilot documents stress that bookmarks store filters, slicers, and visual states. Copilot can summarize data or write narrative‑style text for report visuals, even though it does not directly control bookmarks themselves. For analysts, that means more control over the flow of insights without adding complex DAX or custom cards.
How Bookmarks Enable Dynamic Storytelling
Power BI bookmarks act like snapshots of a report’s state at a given moment. When an analyst sets up a view with specific filters, slicers, and visual formatting, a bookmark can save:
- Data state: Which slicers are applied, which filter context is active.
- Display state: Which visuals are shown or hidden, spotlighted, or resized.
- Page state: Which page is currently selected.
Once defined, bookmarks can be wired to buttons or navigators so that clicking “Next” or “Deeper Dive” jumps the report to a preconfigured state. For example, a finance dashboard can have:
- A bookmark named “Overview” that highlights group‑level KPIs and hides detailed grids.
- A second bookmark “By Region” that shows a map and region‑level chart with appropriate slicers.
- A third “Planned vs Actual” bookmark that overlays budget and performance visuals.
This pattern is the core of interactive storytelling bookmarks and shows how analysts can choreograph a sequence of views that tells a coherent story rather than leaving users to navigate ad‑hoc.
How to Design a Bookmark‑Driven Copilot Narrative
Power BI bookmarks Copilot dynamic storytelling works best when the report flow is planned as a storyline and then annotated with Copilot‑generated text.
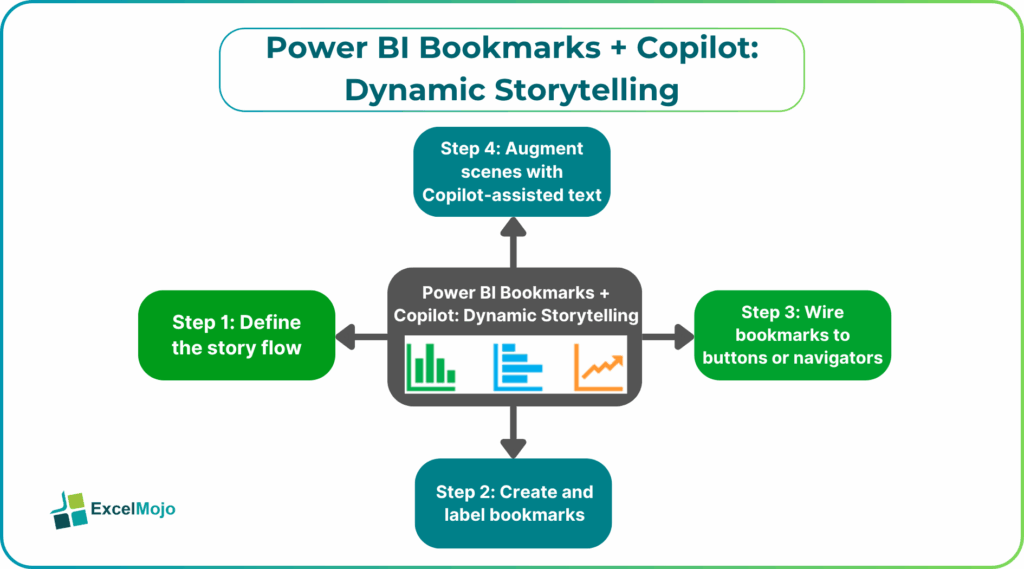
Step 1: Define the Story Flow
Before touching the bookmark pane, sketch the logical sequence:
- A high‑level summary page.
- One or more drill‑down views (by region, by product, by time).
- A final “What‑if” or scenario page.
Each step corresponds to a bookmark or page, and the sequence forms the backbone of the narrative.
Step 2: Create and Label Bookmarks
In Power BI Desktop:
- Go to the View tab and open the Bookmarks pane.
- Apply the desired filters and layout for the current view.
- Click Add to create a bookmark and rename it to match the story step (for example, “Region Drill‑Down” or “Scenario 2”).
- Repeat for each major view.
Power BI’s documentation on bookmarks confirms that each bookmark can selectively store data, display, and page settings, giving analysts fine‑grained control over what the user sees at each step.
Step 3: Wire Bookmarks to Buttons or Navigators
Use the Bookmarks pane to:
- Assign each bookmark to a Button with a clear label.
- Or insert a Bookmark navigator that auto‑populates buttons from the bookmarks list.
This step turns the static list of bookmarks into an interactive storytelling bookmarks experience where users click through the narrative.
Step 4: Augment Scenes with Copilot‑Assisted Text
While Copilot cannot directly open bookmarks, it can enrich each view with narrative text:
- Use the Narrative visual or Copilot‑backed text objects to describe the current bookmark state in plain language.
- Ask Copilot to generate a short paragraph that explains the key insight on the active view, such as “Revenue by region shows North America up 12% year‑on‑year, driven by new product adoption.”
- Paste or refresh this text as reviewers move through bookmarks so the narrative evolves with the visuals.
This approach is part of AI powered Power BI bookmarks automation, where Copilot handles the wording while the bookmark structure handles the flow.
Practical Example: A Month‑End Performance Story
Suppose a finance team builds a month‑end performance dashboard where each
bookmark represents a step in the story.
Bookmark 1 – Executive Snapshot
- K‑PIs such as total revenue, EBITDA, and forecast variance are shown.
- A Copilot‑assisted narrative block highlights the month’s top performers and main risks.
Bookmark 2 – Regional Breakdown
- A map and bar chart show revenue by region, with filters fixed via the bookmark.
- Another narrative block explains regional variances and flags outliers.
Bookmark 3 – Scenario Comparison
- A bookmarked view overlays actual vs. budget for the top accounts.
- The AI‑generated text draws attention to budget overruns and potential drivers.
By connecting the bookmarks to a Bookmark navigator, the team creates a guided, interactive flow that stakeholders can follow. Using Copilot to generate narrative text for each step ensures understand the story without needing to know the underlying model.
Pitfalls and Best Practices
Power BI bookmarks with Copilot introduces a few subtle issues.
One common problem is over‑slicing the flow. Too many bookmarks create a choppy experience. Analysts should keep the sequence tight, ideally 4 to 7 major steps, and use fewer, well‑labeled bookmarks.
Another risk is static text on dynamic views. If Copilot‑generated text is written once and never revisited, it may not match updates to the visuals or filters. Teams should review and update narrative blocks whenever the underlying bookmarks or data structure change.
A third issue is misaligned states. Bookmarks that capture inconsistent combinations of slicers or that hide critical visuals can confuse users. The interactive storytelling bookmarks pattern is most effective when each bookmark represents a clear, self-contained insight and the transitions between bookmarks feel logical.
Frequently Asked Questions (FAQs)
No, Copilot cannot directly open or change Power BI bookmarks. It can, however, generate narrative text for the data in each bookmarked view, and analysts can wire Copilot‑assisted summaries to the scene that each bookmark represents.
Interactive storytelling bookmarks capture not only the page but also filters, slicers, and visual states. Each step in the story is fully preconfigured. Standard page navigation merely moves between pages, leaving slicers and filters up to the user.
AI powered Power BI bookmarks automation can be suitable for regulated reporting if the bookmark structure and filters are reviewed and versioned, and the Copilot‑generated narrative is treated as a draft that is vetted by the reporting team. The bookmarks and underlying model should remain the governed source of truth.