


Introduction
Slicers are added to dashboards by finance teams to let users filter by region, product, or time without touching the underlying data. The usual pattern is to wire each slicer to one or more PivotTables on the same worksheet or workbook. When the same business logic spans multiple reports, maintaining consistent filters becomes tedious. AI Excel slicer connections cross‑report intelligence addresses this by using AI‑driven insights to map which slicers should connect to which tables, and how to share those filters across different worksheets or even dashboards that draw from the same Excel Data Model. When combined with AI powered Excel slicer cross‑report filtering, the result is a more cohesive, low‑maintenance way to explore the same data slice in related reports, such as a high‑level performance sheet and a detailed transaction listing.
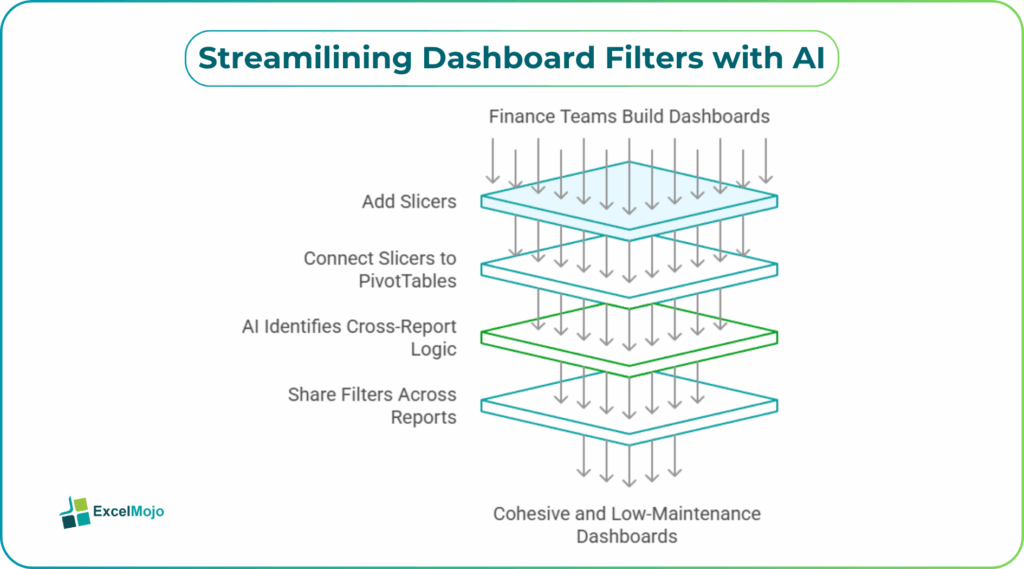
This article explains how to use Excel slicer connections with AI insights to build cross‑report intelligence using AI slicers Excel, how to sync slicers across multiple PivotTables, and how to avoid common misconnections. Slicers can filter tables and PivotTables and the Report Connections feature lets a single slicer control multiple reports when they share the same underlying data set. For analysts, that means less time flipping through menus to wire slicers and more time using those slicers as a single source of truth for cross‑report stories.
What “Cross‑Report Slicer Intelligence” Means
In practical terms, AI Excel slicer connections cross‑report intelligence refers to a pattern where slicers behave like a shared filter layer that spans several reports instead of sitting in isolation on one sheet.
- One slicer for Region can control:
- A high‑level performance PivotTable on the Summary tab.
- A detailed transaction list on the Raw Data tab.
- A chart on the Trend tab.
When the user clicks “Asia” in the slicer, all three respond at once, even if they live on different sheets. This is possible when the PivotTables share the same data source or Excel Data Model and the slicer is properly linked via Report Connections.
This pattern is the core of cross‑report intelligence using AI slicers Excel and helps teams answer questions like “How does Asia look in the summary, and what exact transactions drive that result?” without manually replicating filters.
Using AI‑assisted slicer connections in Excel starts with a clean, model‑based setup and then relies on either manual wiring or AI‑generated guidance for the Report Connections that link each slicer to the right PivotTables.
How to Connect Slicers Across Multiple Reports for AI Excel Slicer Connections Cross‑Report Intelligence?
Step 1: Build a Shared Data Source
- Ensure the main PivotTables that will share slicers are based on the same Excel Data Model or on copies of the same Power Query‑loaded table.
- In the Data Model, define consistent keys such as Region, Product, and Period so the slicer can target the same field across multiple tables.
This step aligns with guidance that slicers sharing a slicer must come from the same or compatible data sets.
Step 2: Create and Link the Slicer
- In Excel, create a slicer on the primary dashboard sheet (for example, for the Region field).
- Right‑click the slicer and choose Report Connections.
- In the dialog, tick the PivotTables on other sheets that should respond to the slicer (for example, the detailed transaction table on the Drill‑down sheet).
- Repeat the process for any other common slicers, such as Period or Product.
This pattern is the backbone of AI enabled slicer dashboards and shows how one slicer can filter multiple visualizations across sheets.
How AI Can help Connect Slicers
Excel slicer connections with AI insights become most useful when the user describes the intended filtering logic and lets AI suggest how to wire the connections.
Step 1: Describe the Reports and Filters
Before asking AI, write a short description such as:
- “I have a Summary sheet with a PivotTable for sales by region and a Drill‑down sheet with a PivotTable for detailed transactions by the same region. Show how to connect a Region slicer so it filters both tables.”
- “Explain how to share a Period slicer between a high‑level KPI sheet and a detailed ledger sheet that use the same data model.”
These statements form the core of the AI prompt.
Step 2: Ask AI for a Step‑by‑Step Connection Guide
A strong prompt for AI powered Excel slicer cross‑report filtering is:
“In Excel, I have a workbook with multiple sheets and PivotTables:
- A ‘Summary’ sheet with a PivotTable for sales by region.
- A ‘Transactions’ sheet with a PivotTable that lists all transactions, including a Region column.
- A slicer for Region on the Summary sheet.
Write instructions for how to use ‘Report Connections’ to link the Region slicer so that it filters both the Summary PivotTable and the Transactions PivotTable.”
AI typically returns something close to the manual steps above, but framed in plain language and tailored to the user’s sheet and field names. This is the core of cross‑report intelligence using AI slicers Excel and shows how AI can reduce the mental load of mapping slicers to multiple reports.
Practical Example: AI Excel Slicer Connections Cross‑Report Intelligence
A common use case is a paired workbook where one sheet shows high‑level performance and another shows the underlying transactions. Using AI Excel slicer connections cross‑report intelligence, the pattern becomes:
- Load the sales and transaction data into the Excel Data Model with a shared Region key.
- Build a PivotTable on the Summary sheet showing metrics by region.
- Build a PivotTable on the Drill‑down sheet showing transaction details, also grouped by region.
- Insert a Region slicer on the Summary sheet and use Report Connections to link it to the Drill‑down PivotTable.
- (Optionally) add an AI‑driven description that explains how the slicer works for the end‑user team.
This workflow is a practical example of AI enabled slicer connections Excel dashboards and demonstrates how cross‑report intelligence helps users move seamlessly from “What” to “Why” with the same filters.
Pitfalls and Best Practices
AI Excel slicer connections cross‑report intelligence can speed up dashboard design but also introduces subtle issues.
One common problem in AI Excel Slicer Connections Cross‑Report Intelligence is misconnected slicers. If a slicer is wired to the wrong PivotTable or to a field that does not match exactly (for example, Region_Code vs Region), the filter may not work as expected. Best practice is to keep column and measure names consistent and to double‑check the Report Connections dialog after each change.
Another risk is over‑filtering. Connecting too many reports to a single slicer can make the dashboard sluggish or confusing if the user forgets how the filters are shared. Teams should limit the scope to a small, coherent set of related reports and document the slicer logic in a short note on the sheet.
A third pitfall is mixing different data sources. If two PivotTables use different data models or tables that are not joined on the same keys, the slicer cannot reliably filter both. Analysts should prefer a shared model or at least one clearly defined key field common to both tables, as shown in best‑practice discussions on sharing slicers across data sets.
Frequently Asked Questions (FAQs)
AI Excel slicer connections cross‑report intelligence can suggest which slicers should connect to which PivotTables and explain how to use the Report Connections feature, but it cannot directly click through the UI in the user’s file. The final wiring still has to be done in Excel, but the AI‑driven instructions make the process much faster and less error‑prone.
AI powered Excel slicer cross‑report filtering and Power BI slicer sync both aim to share a single filter state across multiple visuals, but they work in different environments. Power BI uses model‑based relationships and built‑in slicer properties, while Excel relies on slicers, PivotTables, and the Report Connections feature. Many teams use Excel for quick, ad‑hoc slicer‑driven views and Power BI for enterprise‑level reports.
Excel slicer connections with AI insights can be safe for production if the underlying data model is clean and the connections are tested with typical user filters. Users should avoid randomly connecting slicers to every PivotTable and instead choose a focused set of reports that naturally belong together.
Yes, cross‑report intelligence using AI slicers Excel can work with multiple fields such as Region and Period. The user can create separate slicers for each field and then link them to the same set of PivotTables, so that selecting a region and a period filters all connected reports simultaneously.
Recommended Articles
Continue with these related resources when you want the next practical step in this topic.
Explore the full Excel Tables and Data Tools guide or browse Excel Resources.