


Introduction to Excel Table Design Copilot layouts
Many finance and operations teams still treat Excel tables as plain grids, asking questions like “What should the header be?” or “Which columns should be grouped together?” without a clear, repeatable layout standard. The result is reports that look different from one user to the next, even when the underlying data is similar. Excel Table Design Copilot auto‑optimized layouts changes that by letting analysts ask Copilot to propose a structured, visually consistent layout and then refine the design using the Table Design ribbon rather than manual cell‑by‑cell styling.
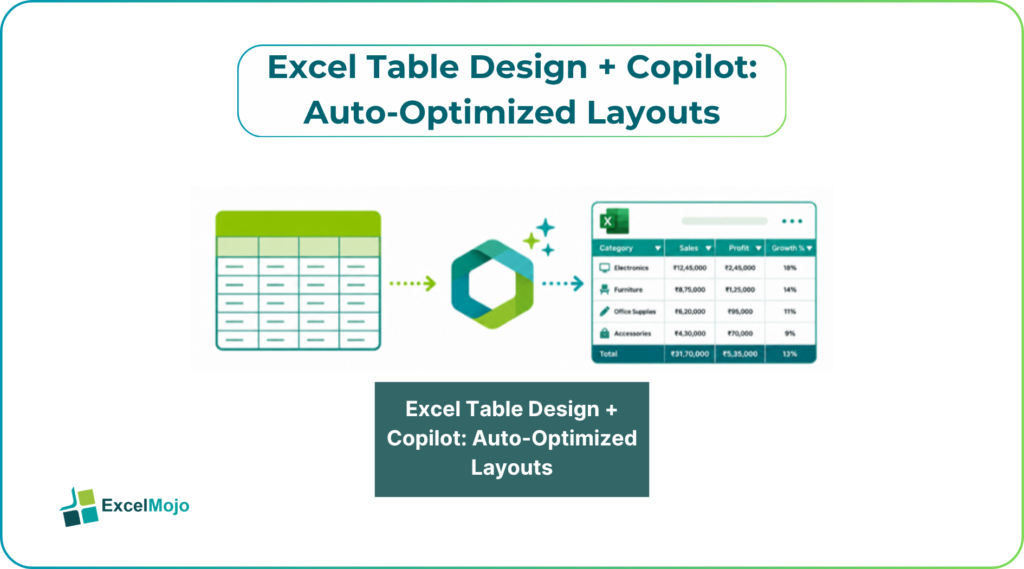
This method of using Excel Table Design with Copilot formatting is where the analyst first defines the logical table structure (columns, data types, key metrics) and then uses Copilot to suggest horizontal groupings, conditional formatting, and header styles. It can add columns, apply conditional formatting, and even change table colors on command. This streamlines the creation and adjustment process once data is formatted as an official table. For Copilot auto‑optimized Excel table layouts, the table object itself becomes the canvas for AI‑driven style and layout decisions while the user remains in control of naming, logic, and business‑rule accuracy.
How Excel Table Design Works
An Excel table is a structured range with its own ribbon controls under Table Design, which lets users resize it, style it, and control features such as header rows, total rows, and banded rows.
Typical patterns include:
- Converting a range to a table (Ctrl + T) so that the Table Design tab appears.
- Using Table Style Options to show or hide headers, totals, and alternating row colors.
- Applying built‑in or custom Table Styles that align with the organization’s branding or report‑pack aesthetic.
This behavior is documented in Excel‑focused guides on table design, which stress that working with proper tables, rather than bare ranges, simplifies sorting, filtering, and formula references and enables features such as structured references and automatic expansion when new rows are added. For AI optimized Excel Table Design layouts, those styling and layout controls become the levers that Copilot can suggest and the user can accept or modify.
How Copilot can Suggest Layouts and Styles
Excel Table Design Copilot style suggestions work best when the analyst presents Copilot with a well‑structured table and a clear prompt about the intended audience and purpose.
A typical workflow:
- In Excel, convert the source range into a proper table.
- Open the Copilot pane and submit a request such as:
- “Create a clean finance‑style layout for this table with banding, conditional formatting for values above 100, and a total row for the revenue column.”
- Or: “Format this table so it is suitable for a quarterly board pack, with clear headers, subtle gray banding, and no gridlines.”
- Copilot interprets the prompt and then applies:
- A suitable Table Style.
- Conditional formatting rules (for example, icon sets or color‑scales on key metrics).
- Visual tweaks such as bolding the header row or highlighting the grand total.
Using this method, Copilot can highlight, sort, filter, and format tables directly from natural language prompts, provided the data is structured as an official table or supported range. For Copilot auto‑optimized table layouts, the table object is the primary target of those suggestions, while the user reviews and, where needed, overrides the proposed changes.
Practical Example: A Quarterly KPI Table for Leadership
A common use case for AI optimized Excel Table Design layouts is a quarterly KPI table that must look consistent across multiple workbooks and presenters.
Suppose the sheet includes a table with columns:
- Metric
- Previous Quarter
- Current Quarter
- Variance %
A Copilot‑assisted workflow might look like this:
- The analyst formats the range as a table, confirms data types are correct, and then opens Copilot.
- They ask: “Format this KPI table for an executive dashboard with a subtle professional style, banded rows, and conditional formatting for the Variance % column to show arrows for positive and negative values.”
- Copilot applies:
- A light‑gray banding theme.
- Icon sets or traffic‑light‑style colors on the Variance % column.
- Formatting that keeps numbers aligned and headers bold but not overly stylized.
Once applied, the analyst can lock the layout by saving the table style as a custom style, so that the next quarterly table inherits the same visual treatment without needing another Copilot session. This pattern illustrates howExcel Table Design Copilot style suggestions can turn a one‑off format request into a repeatable visual standard across many workbooks.
Pitfalls and Best‑Practice Tips
Excel Table Design Copilot auto‑optimized layouts can accelerate formatting work, but it also introduces a few practical pitfalls.
One common issue is over‑designing the table. Copilot‑suggested layouts may include multiple layers of conditional formatting or complex styles that can be hard to maintain or that clash with the organization’s existing templates. Best practice is to keep the core style simple—well‑defined banding, one dominant accent color, and clear, readable fonts—and reserve conditional formatting for just a few key metrics.
Another risk is style inconsistency across workbooks. If each user asks Copilot for a “clean finance‑style table,” the result can still look different because prompts are interpreted slightly differently. Teams should define a small library of approved Table Styles and then use Copilot primarily to apply those predefined styles and basic formatting, rather than to invent new visual concepts for every report.
A third pitfall is ignoring accessibility and printing. Copilot‑driven layouts are tuned for on‑screen appearance, but they may not translate well to black‑and‑white print or for users with color‑vision differences. Analysts should periodically test the table in print preview, verify that text and key values remain legible, and add patterns or clear labels where color alone is used to signal status.
Frequently Asked Questions (FAQs)
Can Excel Table Design Copilot style suggestions replace manual formatting entirely?
Copilot can automate a large portion of formatting and layout decisions, but it should be treated as a co‑designer rather than a replacement for the analyst’s judgment. Best practice is to approve Copilot’s suggestions, keep a small library of standardized styles, and add manual tweaks for edge cases or branding exceptions.
Do Copilot auto‑optimized Excel table layouts work with Excel on the web and Mac?
Copilot features are available in Excel for Windows and the web for users with a Microsoft 365 Copilot license. The exact availability on Mac and older versions depends on the subscription and release schedule, so analysts should confirm Copilot is enabled in their environment before relying on style‑suggestion workflows.
How accurate are Copilot suggestions for Excel Table Design?
Copilot generally proposes sensible styles and common conditional‑formatting patterns, but the accuracy depends on how clearly the user describes the intended audience, purpose, and constraints. Analysts should always test the suggested layout against a sample of real‑world data and refine the style before using it in high‑visibility reports.
Can AI optimized Excel Table Design layouts help align with an organization’s existing report templates?
Yes. Once the team defines a small set of custom Table Styles in the Table Design gallery, those styles can be reused across many workbooks. Copilot can then be instructed to “Apply the ‘Executive KPI’ table style and add conditional formatting for the variance column,” which keeps layouts consistent with existing templates while still allowing tailored visual tweaks.