What is Power BI Reports?
Power BI reports are interactive visualizations of data that provide insights and analysis. They are created using Power BI Desktop, a powerful data modeling, transformation, and visualization tool. Power BI reports allow users to explore data, drill down into details, and create visualizations such as charts, tables, maps, etc. It can contain single or multiple visualizations per business requirements.
Table of contents
Key Takeaways
- Power BI reports are interactive visualizations of data created using Power BI Desktop.
- To create a report, connect to data, transform and shape it, build visualizations, add elements, create relationships, and publish and share the report.
- Power BI reports provide in-depth analysis capabilities and can be customized and shared with others.
- Power BI dashboards offer a summarized view of key metrics from one or more reports, providing a consolidated and real-time monitoring experience.
- Reports and dashboards serve different purposes, with reports focusing on detailed analysis and dashboards on high-level monitoring.
📊 Unlock Advanced DAX Skills in Power BI!
Take your Power BI skills to the next level with our Advanced DAX in Power BI Training Course. Dive deep into advanced DAX functions, complex calculations, and optimization techniques to enhance your data analysis and reporting capabilities.
How To Create Report on Power BI?
To create Power BI Reports, you can follow the below steps:
- Source Data Connection: In Power BI Desktop, you can connect to various data sources such as databases, Excel files, online services, or cloud-based platforms. Import or establish a live connection to the data source.

- Data Transformation: Use Power Query Editor to transform and clean the data, perform calculations, filter rows, create calculated columns, merge tables, and more. This step ensures that the data is in the desired format for analysis.

- Data Visualizations: Drag and drop fields from the data pane onto the report canvas to create visualizations. Choose the appropriate visualization types, customize formatting, and apply filters and interactions to make the report interactive.

- Report Formatting: Enhance the report by adding titles, text boxes, images, shapes, and other design elements to provide context and explanations.

- Create relationships: If your report involves multiple tables, establish relationships between them to enable cross-filtering and slicers for better analysis.

- Apply report-level filters: Set report-level filters to limit the data displayed across all visualizations in the report.

- Publishing Power BI reports: Once the report is ready, publish it to the Power BI service using the Publish functionality in the Power BI Desktop.

- Sharing Power BI reports: You can share these reports with specific individuals or groups, collaborate, embed in applications, and schedule data refresh using Power BI Service.
Power BI Reports design plays a significant role in creating an effective user-centric visualization. The design can be efficiently performed by understanding the business requirement, choosing the proper visualization, creating a logical layout, good user-friendly design, enhancing user interaction, and performance optimization.
In the subsequent section, we will go through some of these examples to understand how you can use the Power BI Reports.
Examples
In this section, we will see two examples where we will provide a step-by-step process to use the Power BI Reports.
Example #1
In this example, we will create a Power BI report on various global metrics, such as the Top 10 countries by GDP, Population, and CPI using the world-data-2023 dataset in Power BI. To use the Power BI parameters, follow these steps:
Step 1: Open the Power BI Desktop and import the world-data-2023 dataset using Data Connection in Power BI. You can also customize the dataset as per requirement by using the Transform Data option.

Once imported into Power BI, you will be able to view the data fields in the Fields pane.

Step 2: Navigate to the Fields tab, select the relevant data fields, and drag and drop them to the report canvas. Now navigate to the Visualization pane and choose the appropriate visuals.
In this example, we have used a stacked column chart, a stacked column bar, and card visuals to create the metrics.

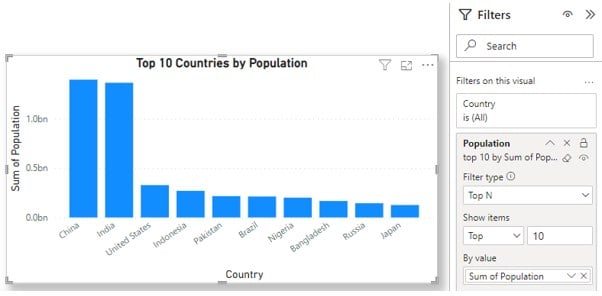
Note that we have applied specific filters to the dataset to create these visuals. For example: For the Top 10 Countries by Population visual, we first sorted the dataset as per population and then applied a filter to restrict it to the top 10 countries by population.

Step 3: Navigate to the Format your visual tab in the Visualization pane and apply the formatting options for each of these metrics.

Step 4: Now once the report is finalized, navigate to the Home tab and select Publish.

It will open a pop-up window highlighting the available destination to choose from in Power BI Service.

Step 5: Choose a destination and click on the Select button.

Once the Power BI publishes the report to Power BI Service, you will see the below success confirmation message on the pop-up window.

Step 6: Log into the Power BI Service and navigate to the My workspace. You will see the published reports and other previously published reports (if any).

Click on the Power BI Reports to view the report visuals.

Example #2
In this example, we will create a sales report highlighting various key metrics such as Total Sales by Product, Total Sales by Country, and Total Sales by Segment using the financials dataset. To create the Power BI reports, follow these steps:
Step 1: Open the Power BI Desktop and import the financials file using Data Connection.

Once imported to Power BI successfully, you can see the data attributes in the Fields pane.

Step 2: Navigate to the Fields tab, select the relevant data fields, and drag and drop them to the report canvas. Now navigate to the Visualization pane and choose the appropriate visuals.
In this example, we have used a stacked column chart, a stacked column bar, and card visuals to create the metrics.

Step 3: Navigate to the Format your visual tab in the Visualization pane and apply the formatting options for each of these metrics.

Step 4: Navigate to the Home tab and select Publish to publish the finalized report to Power BI Service.

It will open a pop-up window highlighting the available destination in Power BI Service.

Step 5: Select the destination and click on the Select button. Once the report publishing is complete, you will get a success pop-up window.

Step 6: Log into the Power BI Service and navigate to the My workspace. You will see the published reports and other previously published reports (if any).

Click on the Power BI Reports to view the report visuals.

Difference between Power BI reports and dashboards
The difference between Power BI reports and dashboards are as follows:
- Power BI Reports are highly interactive and flexible visual representations of data. They can contain multiple pages or tabs, each with various visualizations, and provide in-depth analysis capabilities. Reports allow users to create custom visuals, apply filters, drill down into details, and perform complex calculations.
- Power BI Dashboards: On the other hand, they provide a summarized view of key metrics and visualizations from one or more reports. We create Dashboards to monitor KPIs or to present high-level insights at a glance. They are designed to provide a consolidated view and focus more on real-time monitoring than detailed analysis. Dashboards can include visuals, tiles, images, and text boxes, and they can be customized with filters and pinned visuals from multiple reports.
Important Things to Note
- Power BI reports can connect to a wide range of data sources, including databases, cloud services, files, and more.
- Reports can be refreshed automatically based on a defined schedule or manually refreshed to reflect the latest data.
- Power BI reports can be embedded into other applications, websites, or SharePoint for seamless integration.
- Power BI offers a range of visualizations and customization options to create visually appealing and informative reports.

Frequently Asked Questions (FAQs)
Parameters are important in Power BI paginated reports because they allow users to interactively streamline the data using the filter and customize the report’s data before it is rendered. Parameters provide flexibility and enable users to control the report’s output based on their specific requirements. They can select values, set date ranges, or input custom parameters to refine the report’s results dynamically. Using report parameters, you can filter report data, narrow down specific contents as per user access and customize the visualization of the report.
To deploy Power BI reports to a production environment, you typically follow these steps:
• Publish the Power BI report: Use the Publish functionality in Power BI Desktop to publish the report to the Power BI service.
• Configure automated data refresh: Set up a data refresh schedule to keep the data up to date in the production environment especially if your reports are based on data from external sources.
• Manage User Permissions: Set appropriate permissions for the report to control who can access and view it.
• Share the report: Depending on your requirements, you can either embed the report in other applications.
To merge two Power BI reports, you have a few options:
• Copy and paste: Open both reports in Power BI Desktop and copy visual elements from one report to the other.
• Import data from multiple sources: If the reports are based on different data sources, you can combine the data sources in Power Query Editor by importing data from both sources and merging or appending the data tables as needed.
• Report-to-report integration: Power BI offers report-to-report integration, where you can embed one report as a tile in another report. It allows you to consolidate multiple reports into a single dashboard-like experience.
Power BI reports can update automatically depending on how they are configured. If your report is connected to a live data source or scheduled for automatic data refresh, the report will update automatically based on the defined refresh schedule.
Recommended Articles
This has been a guide to Power BI Reports. Here we learn how to create & use power bi reports for visualization of data with examples. You can learn more from the following articles –

Leave a Reply