What are Parameters in Power BI Report?
BI Reports are user-defined variables that allow users to customize and interact with the report. They provide a way to dynamically change aspects of the report, such as filters, data ranges, or even data sources. Power BI Parameters can enhance report interactivity and make the report more flexible for different users or scenarios. Using Power BI Parameters, you can efficiently implement means to create variables that can be used in your reports, interact with the variable as a slicer, and data visualization and quantification of various key values in your reports.
Table of contents
Key Takeaways
- Power BI Parameters in Reports enable users to customize and interact with the report by dynamically changing aspects such as filters, data ranges, and data sources.
- Parameters can be used in filters, calculations, visual interactions, and other parts of the report to enhance interactivity and flexibility.
- You can use the Power BI parameters in DAX expression to create calculated columns or measures to be used in a report or analysis.
- Users can interact with parameters by adjusting their values through the “Selection Pane” in Power BI Desktop.
- Validating and handling parameter inputs properly is crucial to ensure the accuracy and reliability of the report.
📊 Unlock Advanced DAX Skills in Power BI!
Take your Power BI skills to the next level with our Advanced DAX in Power BI Training Course. Dive deep into advanced DAX functions, complex calculations, and optimization techniques to enhance your data analysis and reporting capabilities.
How to Use Parameters in Power BI Report?
To use parameters in Power BI Reports, follow these steps:
Create a Parameter in the Power BI.
- Open your Power BI Desktop.
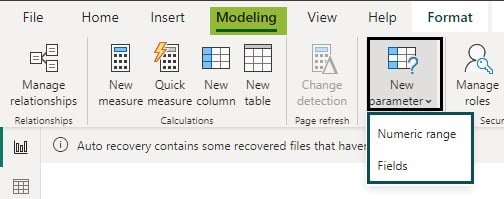
- Navigate to the Modeling tab and select the New parameter option in the Power BI Desktop.

- Choose either the Numeric range or Fields option to create a new parameter.
Option – 1: Numeric range variable
- Choose the Numeric range option. This will open a pop-up window with a set of values to choose from as highlighted below.
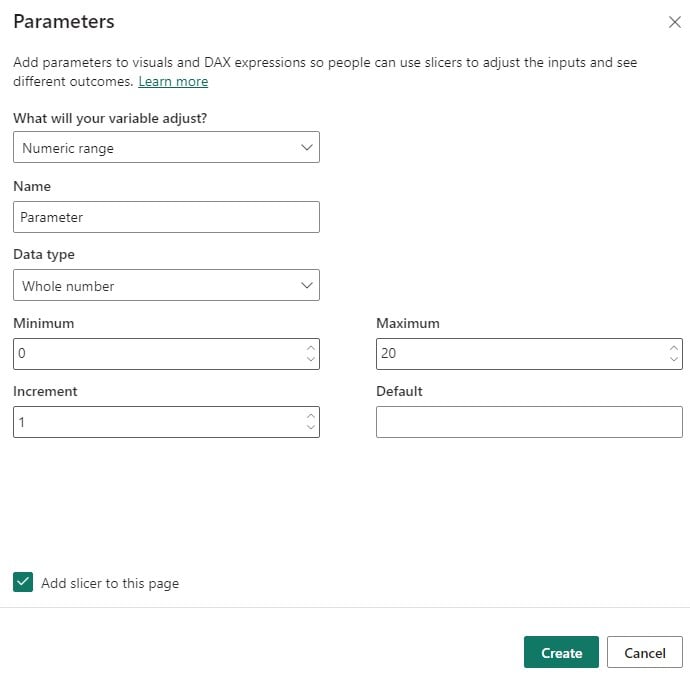
- Provide the parameter’s Name, Data type, Minimum, Maximum, Increment, and Default value.
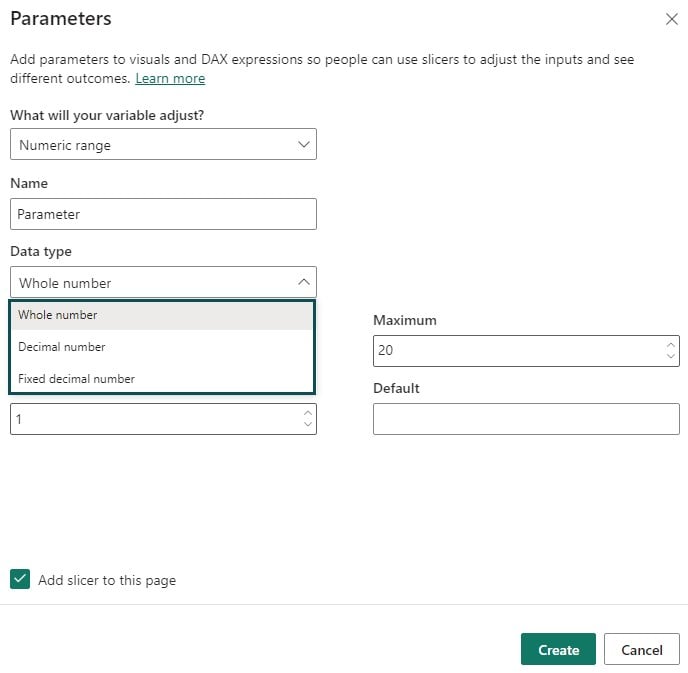
You can choose from Whole number, Decimal, or Fixed decimal number data types from the available options. The Minimum, Maximum, and Increment values are denoted in percentages.
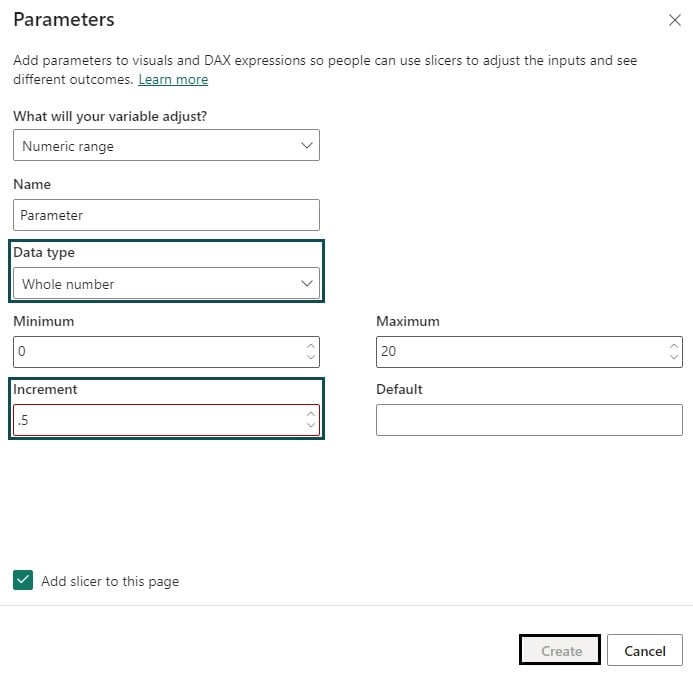
Note: Ensure that you specify the values in the Minimum, Maximum and Incremental fields as per the data type selected. Else Create button will not be enabled.
Option – 2: Fields variable
- Similarly, you can also choose the Fields variable option to adjust.
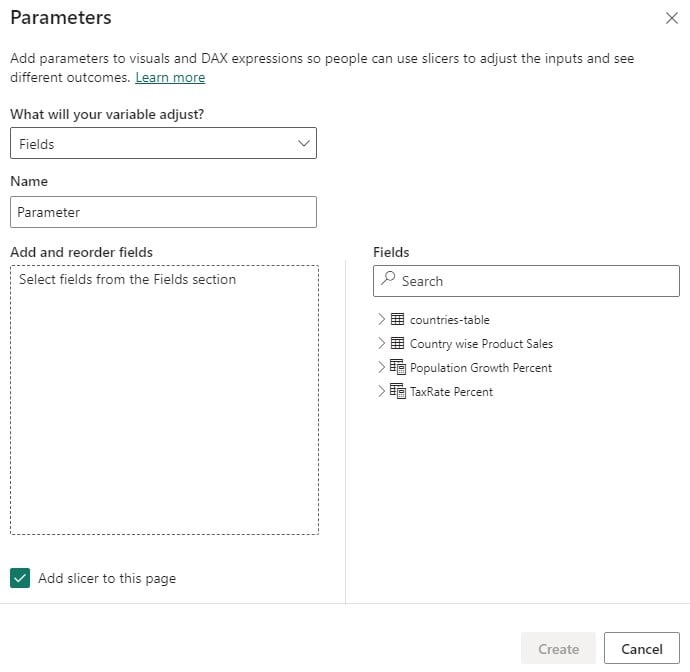
- Specify the details on the Parameters page, such as Name and Fields. You can rearrange the order of the fields as required.
Note: Regardless of option 1 or 2, selecting Add slicer to this page will automatically add a slicer to the current report page in the Power BI. Using the Power BI parameters slicer, you can filter the data based on predefined values.
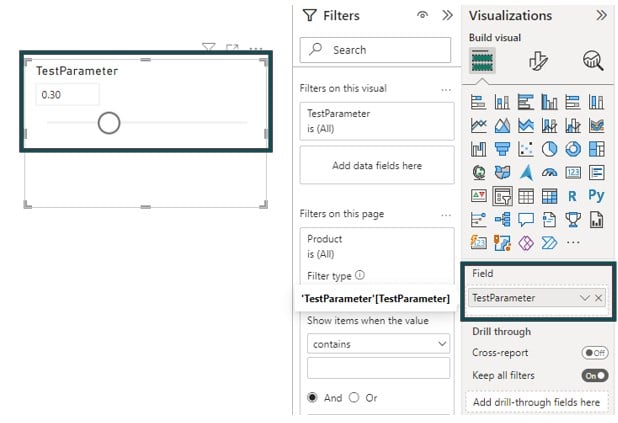
In this process, measures are automatically created that can be used to visualize the parameter’s current value, as shown below. The parameter and the measure can be used in report pages and customized depending on the reporting requirements.

Step 2: Use the parameter in a report:
- Once you have created the parameter, you can use it in various parts of your report, such as filters, calculations, measures, or visual interactions.
- To use them in a measure or calculation, add the Power BI parameters in DAX in the formula bar. This would create a measure or perform the calculation as per the values in the parameters.
- To use a parameter in a filter, select a visual, go to the Visualizations pane, and drag the desired field to the Filters section in Power BI.
- In the filter settings, click on the Add filter button and choose Advanced filtering options.
- In the Advanced filtering options, select the parameter you created from the dropdown and define the condition for the filter.
Step 3: Interact with the parameter.
- To interact with the parameter, go to the View tab and enable the Selection Pane.
- In the Selection pane, locate the parameter and click on the slider icon next to it.
- You can slide the icon to adjust the parameter value and associated impact on your reports.

Power BI Parameters provide flexibility to be used across multiple areas. The Power BI parameters slicer can filter the dataset based on a predefined value. Similarly, the Power BI parameters query enables you to define and reference a parameter in your query steps. You can even use the Power BI parameters for data sources such as database connection strings.
In the subsequent section, we will go through some of these examples to understand how you can use the Power BI Parameters.
Example of Parameter in Power BI
In this section, we will see two examples where we will provide a step-by-step process to use the Power BI Parameters.
Example #1
In this example, we will create a Taxrate percent parameter to assess the impact of the increase in tax rates on the overall profitability of each of the segments by using the Country_Product_Sales dataset in Power BI. To use the Power BI parameters, follow these steps:
Step 1: Open the Power BI Desktop and import the Country_Product_Sales dataset using Data Connection. You can also customize the dataset as required using the Transform Data option.
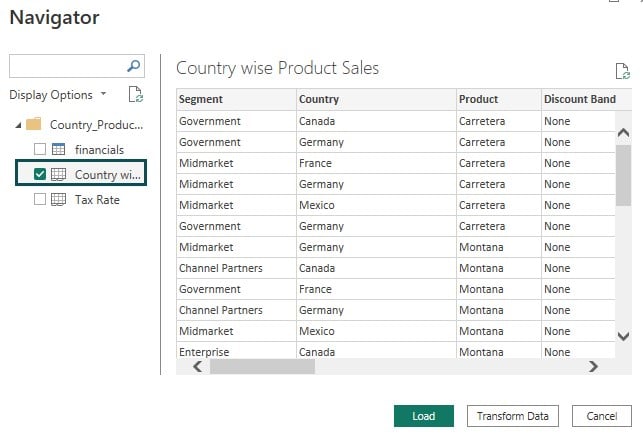
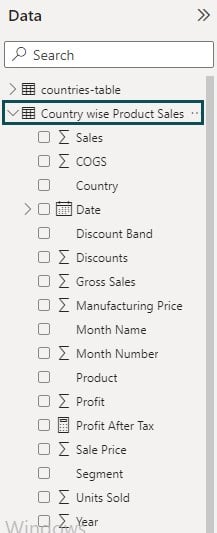
Once imported into Power BI, you will be able to view the data fields in the Fields pane.
Step 2: Navigate to the Modeling tab and choose Numeric range under the New parameter option.

It will open a pop-up window with Parameter configuration details that users can provide.
Step 3: Provide the details such as Name, Data type, Minimum, Maximum, Increment, and Default value (if applicable) to create a parameter.
Here we have created the TaxRate Percent parameter with the data type as a Decimal number. We have specified the Minimum value as 0.1, the Maximum value as 1 with an incremental value of 0.05.

Once you click on Create button, the TaxRate Percent parameter will be created with a slider to adjust the values. You can use this Power BI parameters slicer to filter the dataset in the report visual.
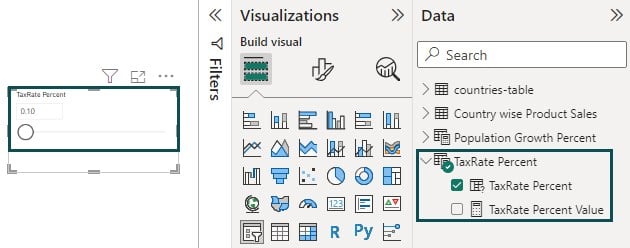
Step 4: Navigate to the Modeling tab and select the New Measure option.

Step 5: Use the Power BI parameters in DAX expression in the formula bar to create a new measure Profit After Tax and Click on the Commit icon to save the changes.

It will create a new measure Profit After Tax to the Country wise Product Sales dataset.

Step 6: Navigate to the Visualization pane, choose Clustered column chart visual, and drag and drop the field attributes from the Fields pane to the report canvas. Format the headers and other configurations as needed.
It will create a chart showing Profits per segment and Profits After Tax per segment. Using Power BI parameters slicer TaxRate Percent, You will see the changes in Profits After Tax.

Example #2
In this example, we will use create a Population Growth Percent parameter to project the population growth for each of the countries using the countries-table dataset. To use the Population Growth Percent parameter, follow these steps:
Step 1: Open the Power BI Desktop and import the countries-table file using Data Connection.

Once imported to Power BI successfully, you can see the data attributes in the Fields pane.

Step 2: Navigate to the Modeling tab and choose Numeric range under the New parameter option.
Here we have specified the data type as a Decimal number with a Minimum value of 0 and a Maximum of 1 with an Increment of 0.01.

Once you click on Create button, the Population Growth Percent parameter will be created with a slider to adjust the values.
As you can see the Minimum value of this parameter is set at 0.00. Additionally, this will create measures as highlighted below in the Fields pane.

Step 3: Navigate to the Modeling tab and select New measure.

Step 4: Use the Power BI parameters in DAX expression in the formula bar to create the measure.
Here, we have created a measure Estimated Population to project the population growth based on the Population Growth Percent parameter.

Step 5: Navigate to the Visualization pane, choose Table Visual, and drag and drop the field attributes from the Fields pane to the report canvas. Format the headers and other configurations as needed.
This will create a table showing the Estimated Population per country. You will see the changes in Estimated Population by sliding the Population Growth Percent slider.

Important Things to Note
- Parameters can be used with various data sources in Power BI, including databases, Excel files, web services, etc.
- Parameters can be used to filter data, define calculated columns or measures, customize visuals, or even control data refresh settings.
- Parameters can be used individually or in combination to create more complex scenarios and enhance report interactivity.
- It is important to validate and handle parameter inputs appropriately to ensure the accuracy and reliability of the report.
- There can be a maximum of 1000 unique values that parameters can have. Beyond 1000 unique values, the parameter values will be evenly sampled.
- Parameters work best when used in measures within visuals and it may not perform proper calculation if used in a dimension calculation.

Frequently Asked Questions (FAQs)
Parameters in Power BI Paginated Reports are crucial for enhancing report interactivity and flexibility. They allow users to dynamically customize the report’s behavior by selecting or inputting values at runtime. Parameters enable users to filter data, change report outputs, and adjust calculations, providing a more personalized and interactive experience.
To create parameters in Power BI Reports, follow these steps:
• Open your Power BI Desktop.
• Navigate to the Modeling tab, select the New parameter option, and choose either the Numeric range or Fields option.
• This will open a pop-up window with Parameter configuration details that users can provide.
• Specify the details such as Name, Data type, Minimum, Maximum, Increment, and Default value in the Parameter window.
• Click Create button to create the parameter.
• Alternatively, you can also create parameters using the Power Query Editor through Manage Parameters option.
Parameters in Power BI reports may not work due to various reasons, such as:
• Ensure that the parameter properties, such as data type, default value, and allowed values, are set correctly.
• Check if the parameter is properly linked to the data model and applied in the appropriate filters.
• Verify that the parameter data type matches the field or column it is interacting with.
• If the report is published or refreshed, ensure that the parameters are correctly configured in the published dataset.
Power BI Parameters Query in Power BI are used to dynamically modify the data retrieval process for a dataset. Power BI parameters query allows users to define and change parameter values during data refresh or query execution. Power BI parameters query enables dynamic filtering, data source customization, and parameter-driven data transformations, making reports adaptable to different scenarios and user requirements.
Recommended Articles
This has been a guide to Power BI Parameters. Here we learn the step-by-step process to use parameters in power bi report with examples. You can learn more from the following articles –

Leave a Reply