
Introduction
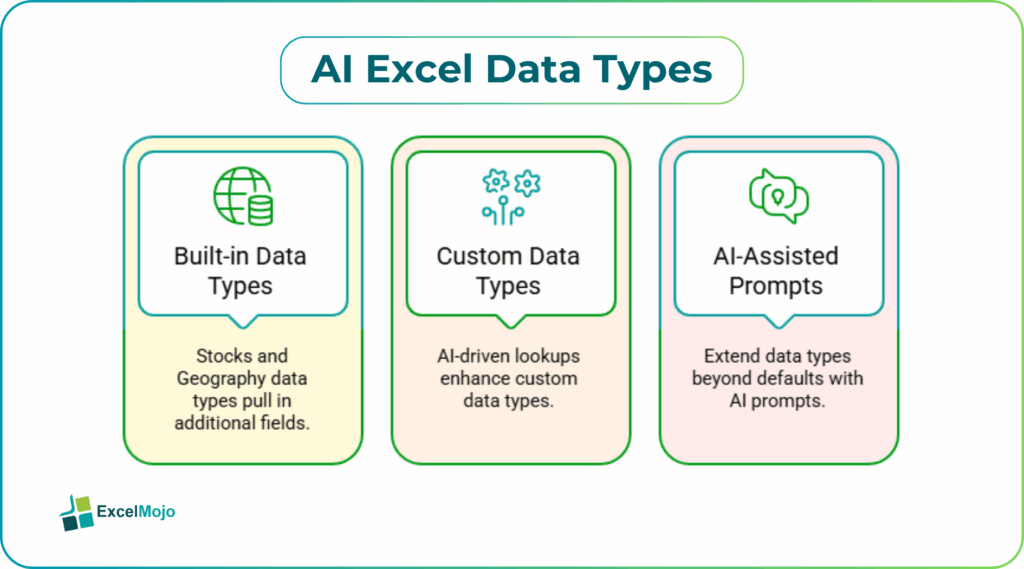
Finance professionals work with lists of entities such as stock tickers, country names, or customer codes that carry rich metadata outside the raw text. Manually appending current prices, regions, or currency codes is time‑consuming and error‑prone. AI Excel data types solve this by letting Excel recognize these entities as structured “objects.” They pull in additional fields such as prices, locations, or currencies through builtin Stocks and Geography data types, or by creating custom data types enhanced with AI‑driven lookups. When paired with AI‑assisted prompts, these data types objects can be extended beyond the default types to support internal codes, product SKUs, or scenario tags.
This article shows how to use Excel AI data types stocks and Excel AI geography data type to add live market and location data. It also shows how to design custom data types in Excel with AI that behave like domain‑specific objects. Readers will see how AI Excel data types can turn a flat table of symbols or regions into a rich, field‑driven grid that supports formulas such as =A2.StockPrice or =B2.CountryCode. Microsoft’s documentation confirms that these types surface under the Data tab, require a modern Excel version and online connectivity. They expose multiple related fields via IntelliSense‑style dot‑notation access. For analysts, this means richer, more maintainable data models without leaving Excel.
How Stocks and Geography Data Types Work
Excel’s Stocks and Geography AI Excel Data Types treat cell content as an entity and attach metadata to it.
- Stocks data type:
When a ticker such as MSFT or GOOGL is converted to a Stocks data type, Excel can attach fields like current price, market cap, currency, exchange, and more, depending on the available data feed. Users can then access these via formulas like:
=A2.Price
=A2.MarketCap
=A2.Currency
- These Excel AI data types stocks behave like lightweight objects, letting analysts build valuation models or dashboards without manually typing each metric.
- Geography data type:
When a country, region, or city name is converted to the Geography data type, Excel can attach fields such as country code, continent, population, or time‑zone data. A formula such as:
=B2.CountryCode
=B2.Continent
- exposes this metadata as scalar values that can be used in filters, aggregations, or model logic. This is the core of Excel AI geography data type and shows how Excel can turn textual labels into structured, queryable data.
Both types rely on an online service that resolves the text into an entity and returns a set of supported fields. The behavior is similar to an AI enabled Excel data types objects layer, even though the underlying logic is builtin rather than user‑defined.
How to use Stocks and Geography in a Finance Model
AI Excel data types fit naturally into common finance workflows.
Example 1: A Stock‑Level Valuation Sheet
Suppose a portfolio manager tracks a small universe of seven stocks. Using Excel AI data types stocks, the team can:
- Enter tickers in column A (for example, AAPL, GOOGL, MSFT).
- Use Data -> Data Types -> Stocks to convert the range to the Stocks data type.
- In column B, use =A2.Price to pull the current price.
- In column C, use =A2.MarketCap to pull the market cap.
This structure turns a static list into a dynamic model that updates prices when the workbook refreshes, reducing the need to manually download or copy‑paste data.
Example 2: A Region‑Based Scenario Workbook
For a global forecast, the Excel AI geography data type can help:
- Enter city or country names in a column.
- Convert the range to the Geography data type.
- Add columns such as =B2.CountryCode, =B2.Population, or =B2.Continent to support regional filters or allocation logic.
This approach is a practical example of AI enabled Excel data types objects in a regional planning context.
Creating Custom Data Types with AI Assistance
Beyond the builtin types, analysts can design custom AI Excel Data Types around internal entities such as customer IDs, product SKUs, or scenario codes.
Step 1: Define the Entity and its Fields
Write down the entity and its attributes. For example, a “CustomerSegment” object might include:
- SegmentName
- SegmentCode
- Region
- RevenueBucket
- LastReviewedDate
These fields form the basis for a custom data type, even though Excel does not expose a direct UI to define new types.
Step 2: Use AI to Generate Lookup Structures
In practice, analysts simulate a custom data types in Excel with AI layer by:
- Building a reference table that lists each unique entity and its fields.
- Using AI‑assisted prompts to generate lookup formulas (for example, XLOOKUP or INDEX/MATCH patterns) that fetch specific fields for a given entity code.
An AI prompt such as:
“Create an XLOOKUP formula that returns the Region from a table named ‘CustomerSegments’ when given a SegmentCode in cell A2.”
typically yields:
=XLOOKUP(A2, CustomerSegments[SegmentCode], CustomerSegments[Region])
This pattern is the closest to an AI enabled Excel data types objects behavior in pure‑Excel workflows and can be reused across models.
Step 3: Wire Lookups into Model Logic
Use the AI‑generated formulas to populate supporting columns that behave like object fields. For example:
- =XLOOKUP(CustomerCode, CustomerTable[Code], CustomerTable[Region])
- =XLOOKUP(CustomerCode, CustomerTable[Code], CustomerTable[Segment])
These fields can then be used in pivot tables, scenario filters, or validation logic, effectively creating a custom data types in Excel with AI‑style interface.
Pitfalls and Best Practices
AI Excel data types are powerful but come with limitations.
One common issue is over‑reliance on live feeds. Stocks and Geography types depend on online data sources, and connectivity or quota limits can break formulas. Analysts should treat them as enhancement layers, not core model engines, and keep critical inputs in static, version‑controlled ranges.
Another risk is data ambiguity. Excel may misidentify a text label as the wrong entity (for example, a historic ticker that no longer trades, or a city name that matches multiple locations). Users should test the data‑type assignment on a small sample and validate the returned fields before trusting them in production models.
A third challenge is performance with large lists. Converting thousands of cells to Stocks or Geography can slow down the workbook. The best practice is to keep the data‑type conversion to small, high‑value universes and lean on indexed lookup‑tables plus AI‑assisted formulas for the rest.
Frequently Asked Questions (FAQs)
AI Excel data types such as Stocks and Geography provide a convenient way to pull live fields inside Excel. However, they should not replace formal ETL or database feeds for mission‑critical pricing or risk systems. They are best used for analytical models and scenario planning that tolerate some latency.
Excel AI data types stocks automate the mapping of tickers to live price, cap, and exchange metadata, while manual entry requires the user to copy‑paste each field. This reduces human error and speeds up model updates, but still depends on the underlying data service’s availability.
Excel does not expose a UI to define fully new objects‑like data types beyond Stocks and Geography. However, analysts can simulate custom data types in Excel with AI using reference tables, lookup formulas, and AI‑generated formula patterns that behave similarly from a modeling perspective.
AI enabled Excel data types objects can be used as inputs to VBA macros or Power BI reports, but the dot‑notation fields must be resolved into plain‑cell values first. The data‑type behavior is largely an Excel‑client‑side feature, and downstream tools see the underlying numeric or text content rather than the typed objects themselves.