
What Is Regression Analysis In Google Sheets?
Regression Analysis in google sheets is used to find the relationship between dependent variable and independent variables. It is one of the methods categorized under statistical functions in google sheets and Excel.
Note that the commonly used regression analysis in google sheets is linear regression in google sheets.
Use this Regression Analysis In Google Sheets Template to follow along with the examples in this article.
Download Excel TemplateFor example, consider the below table showing units and sales in google sheets. Now, let us use regression analysis in google sheets for the given table.

The steps are:
Step 1: To begin with, select the data and click on Insert option. Next, choose Charts.
Step 2: Next, under the Chart Type, select Scatter Chart.
Step 3: Then, click on Customize and select Series. Now, scroll down and click on Trendline.
We can see the regression analysis graph as shown in the below image.

Likewise, we can create regression analysis in google sheets.
Note that we can add equation if necessary from the options available in google sheets’ edit chart category.
In this article, let us learn regression analysis.
Key Takeaways
- Regression Analysis in google sheets helps users find a relationship between dependent variable and independent variables.
- This method is categorized under statistical functions in google sheets and is similar to the regression analysis performed in Excel.
- Remember that there is no Data Analysis in google sheets.
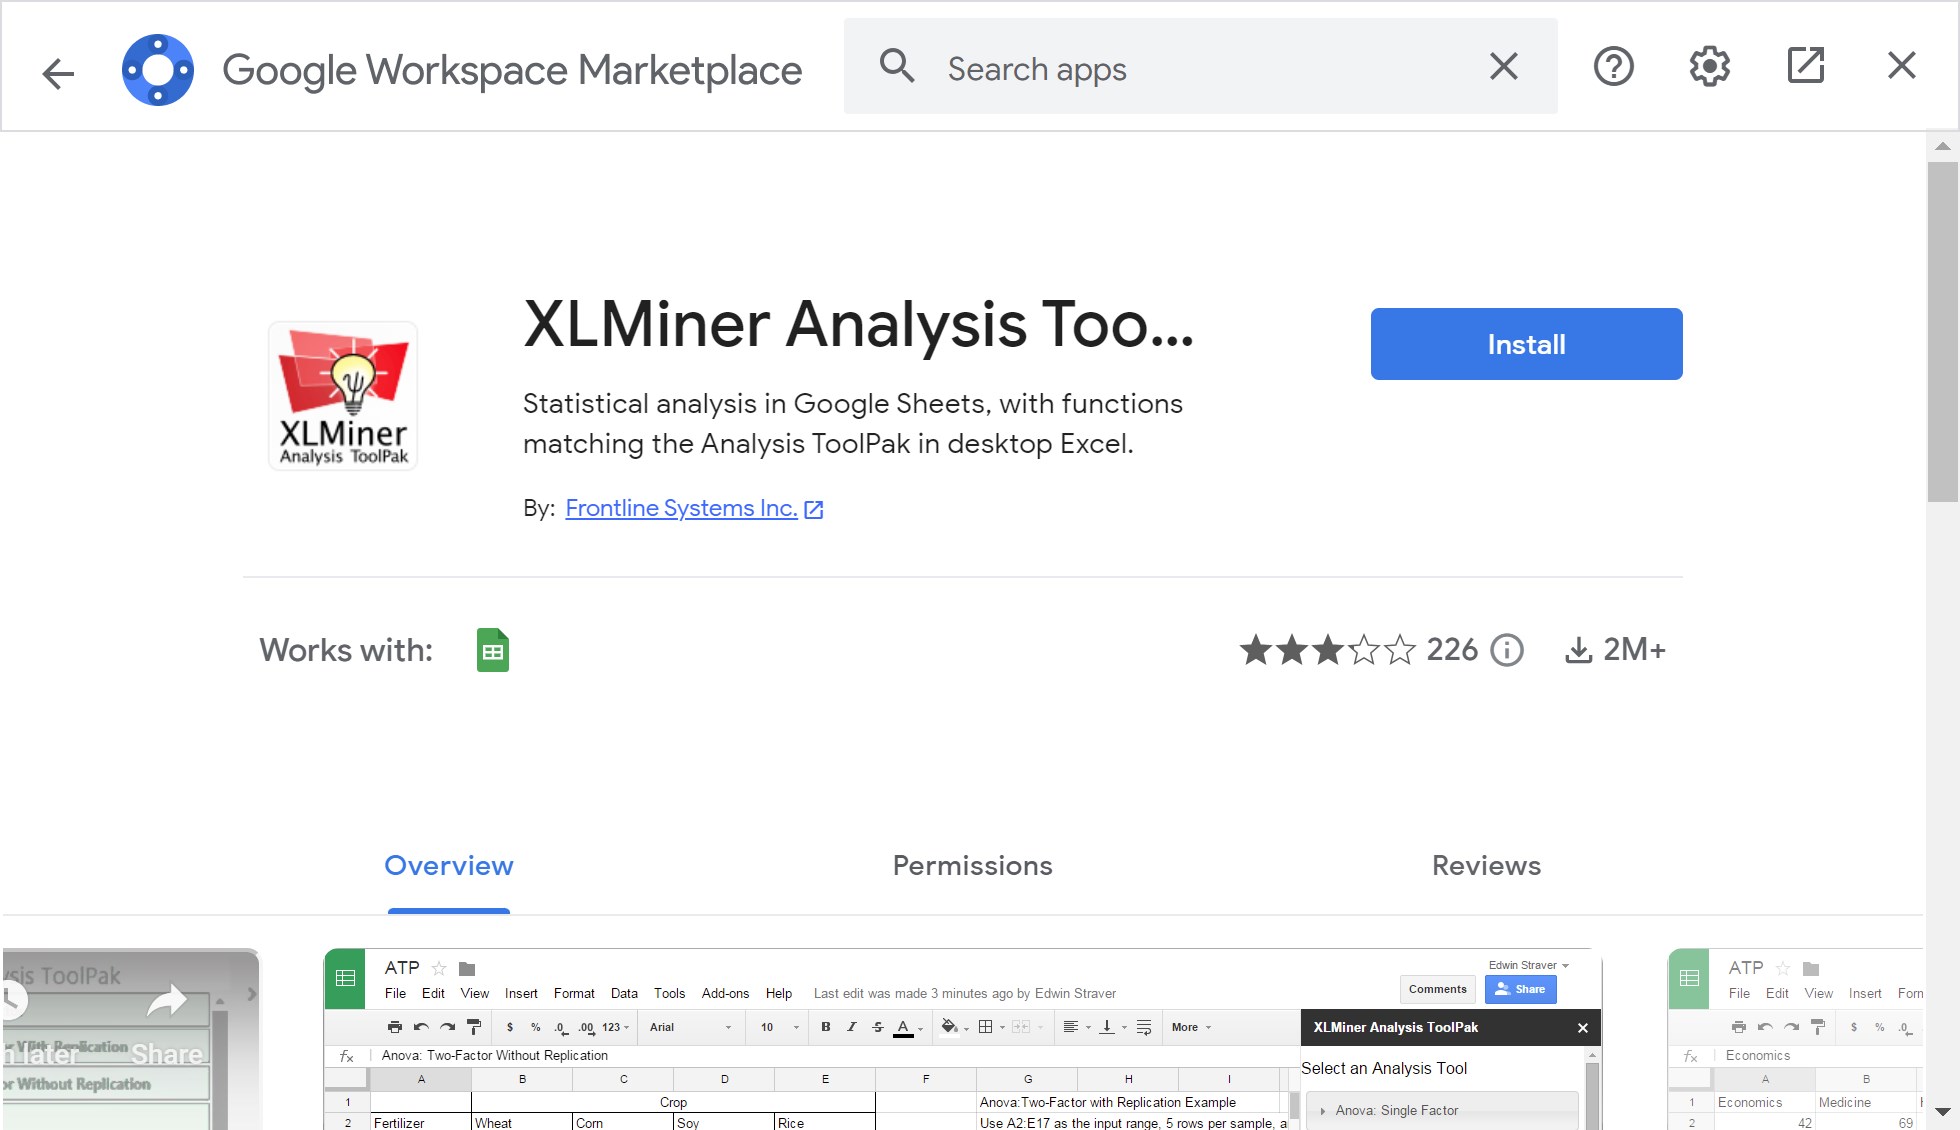
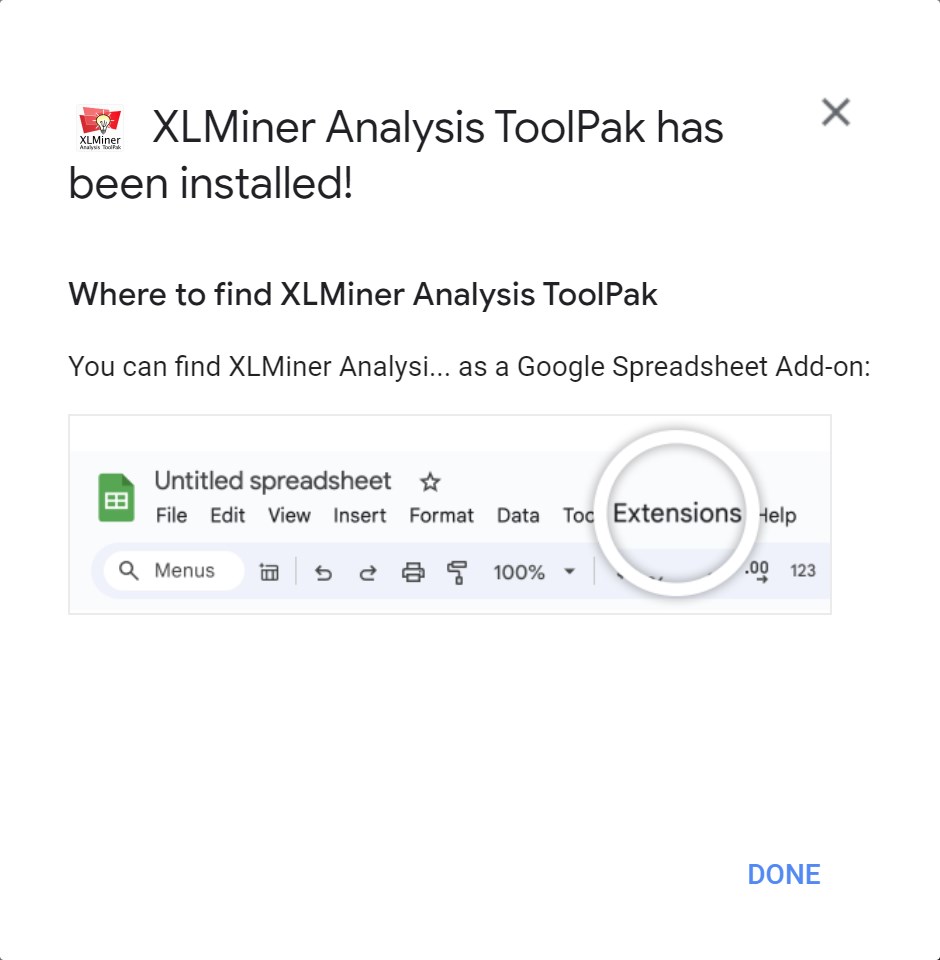
- We need to install XLMiner Analysis ToolPak in google sheets. Simply click on Extensions > Add-ons and search for XLMiner Analysis ToolPak in the pop window. Click on Install.
- Note that the commonly used regression analysis is linear regression in google sheets.
How To Run Regression Analysis Tool In Google Sheets?
Generally, in Excel, we can use regression analysis using Analysis ToolPak. But, in google sheets, we can run regression analysis with just a few clicks.
First, we need to install XLMiner Analysis TookPak.
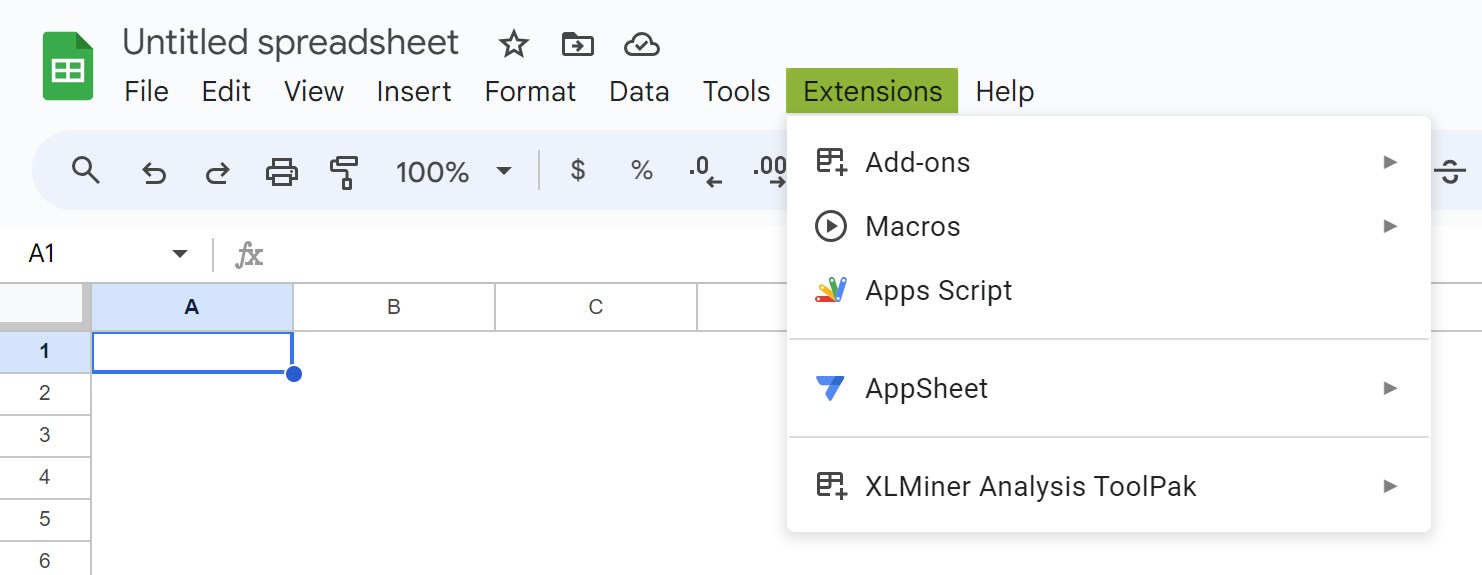
- Open Google Sheets and click on Extensions and select Add-ons.

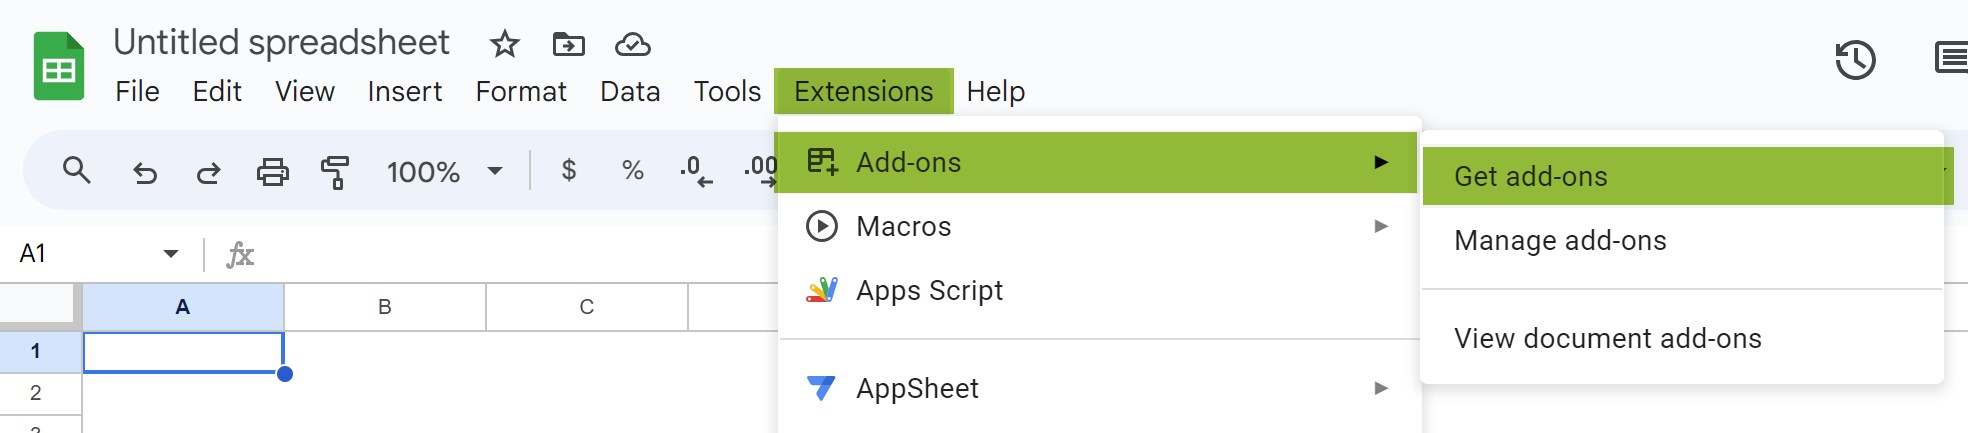
- Next, click on Get add-ons. A popup window appears.

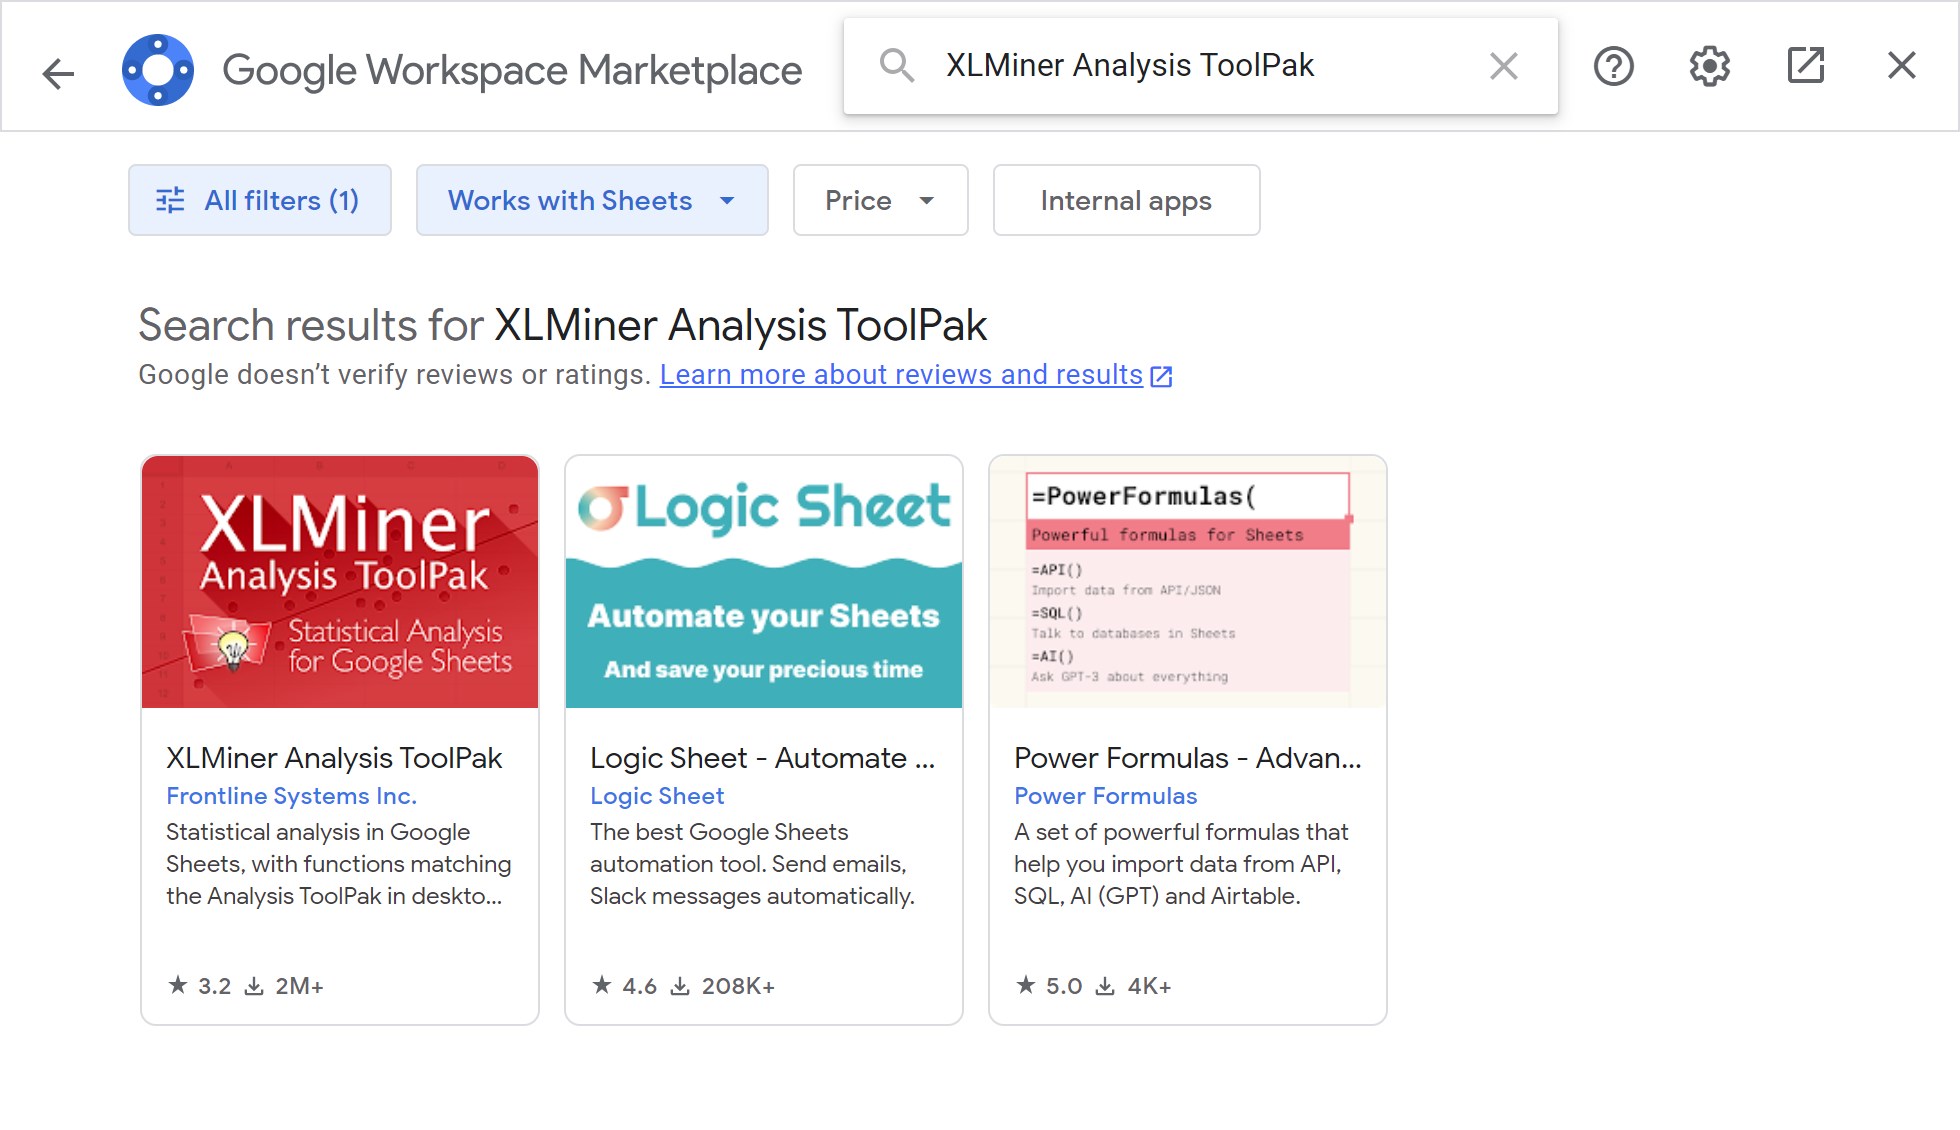
- In the search bar, type XLMiner Analysis ToolPak and press Enter key to search.

- Finally click on Install button.
- The Get ready to install window pops up.

- The XLMiner Analysis ToolPak has been installed! window pops up.


We can now use XLMiner Analysis ToolPak.
How To Use Regression Analysis Tool In Google Sheets?
Let us learn how to use the XLMiner Analysis ToolPak add-on.
After we install the add-on, we can start using the XLMiner Analysis ToolPak immediately.
The steps to use regression analysis tool in google sheets are:
Step 1: To begin with, click on Extensions and select Add-ons.
Step 2: Next, click on XLMiner Analysis ToolPak. Go to the next step.
Step 3: Select Start.

Step 4: We can see a toolbar on the right side of the google sheets. Look in the below image.

Step 5: In this toolbar, there are several options such as Anova, Correlation, Covariance, Descriptive Statistics, Exponential Smoothing etc.,
Remember that the XLMiner Analysis ToolPak is similar to Data Analysis ToolPak in Excel.
Examples
Example #1
Consider the below table showing the year, product and price in columns A, B and C, respectively.

Let us learn how to do regression analysis for the given table.
The steps are:
Step 1: To begin with, insert the data in the google sheets.
Step 2: Next, select Extensions and click on XLMIner Analysis ToolPak. In the available options, click on Start.

Step 3: The XLMiner Analysis ToolPak toolbar appears on the right side.

Step 4: Now, click on Linear Aggression and select the Input X and Y Ranges and Labels. Similarly, select Residuals and insert the Output Range.

Step 5: Press Enter.

We can see the result as shown in the image.
Likewise, we can use regression analysis with XLMiner Analysis ToolPak.
Example #2
For example, consider the below table showing units and values in google sheets. Now, let us use regression analysis for the given table.

The steps are:
Step 1: To begin with, insert the LINEST function.
Select the arguments as shown in the below image.
Step 2: Press Enter key.
We can find the result as shown below.

Step 3: Next, insert the INTERCEPT function.
Select the arguments as shown in the below image.

Step 4: Press Enter key.

Step 5: Next, insert the SLOPE function.
Select the arguments as shown in the below image.

Step 6: Press Enter key.
We can find the result as shown below.

Step 7: Next, insert the SLOPE function.
Select the arguments as shown in the below image.

Step 8: Press Enter key.
We can find the result as shown below.

Likewise, we can create regression analysis.
How To Create Regression Graph
The steps are:
Step 1: To begin with, select the data and click on Insert option. Next, choose Charts.
Step 2: Next, under the Chart Type, select Scatter Chart.
Step 3: Then, click on Customize and select Series. Now, scroll down and click on Trendline.
We can see the regression analysis graph.
Likewise, we can create regression analysis.
Regression Using Google Sheets Formula
In Google Sheets, we can do linear regression analysis using LINEST function.
The formula of LINEST function in google sheets is =LINEST(known_y’s, [known_x’s], [const], [stats])
- `known_y’s`: This is the range of cells containing the dependent variable (Y).
- `known_x’s`: This is an optional argument representing the range of cells containing the independent variable (X). If omitted, the function assumes X values are sequential integers starting from 1.
- `const`: This is an optional logical argument that specifies whether to include a constant term (intercept) in the regression equation. Use `TRUE` to include the constant (default) or `FALSE` to exclude it.
- `stats`: This is an optional logical argument that specifies whether to include additional regression statistics. Use `TRUE` to include additional statistics like R-squared and standard error, or `FALSE` to exclude them (default).
Press Enter key.
Important Things To Note
- Regression Analysis in google sheets studies the relation between two variables.
- Categorized under statistical functions in google sheets, users can create regression analysis charts with trendline.
- We can also use the formulas such as LINEST, INTERCEPT etc to find regression analysis.
Frequently Asked Question (FAQs)
In Google Sheets, you can perform regression analysis using the built-in functions such as LINEST or the Analysis ToolPak add-on. This allows you to calculate coefficients, predict values, and assess the goodness of fit of the regression model.
Consider the below example. Let us use regression analysis chart in google sheets.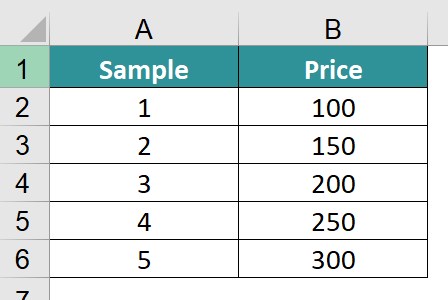
The steps are:
Step 1: To begin with, select the data and click on Insert option. Next, choose Charts.
Step 2: Next, under the Chart Type, select Scatter Chart.
Step 3: Then, click on Customize and select Series. Now, scroll down and click on Trendline.
We can see the regression analysis graph as shown in the below image.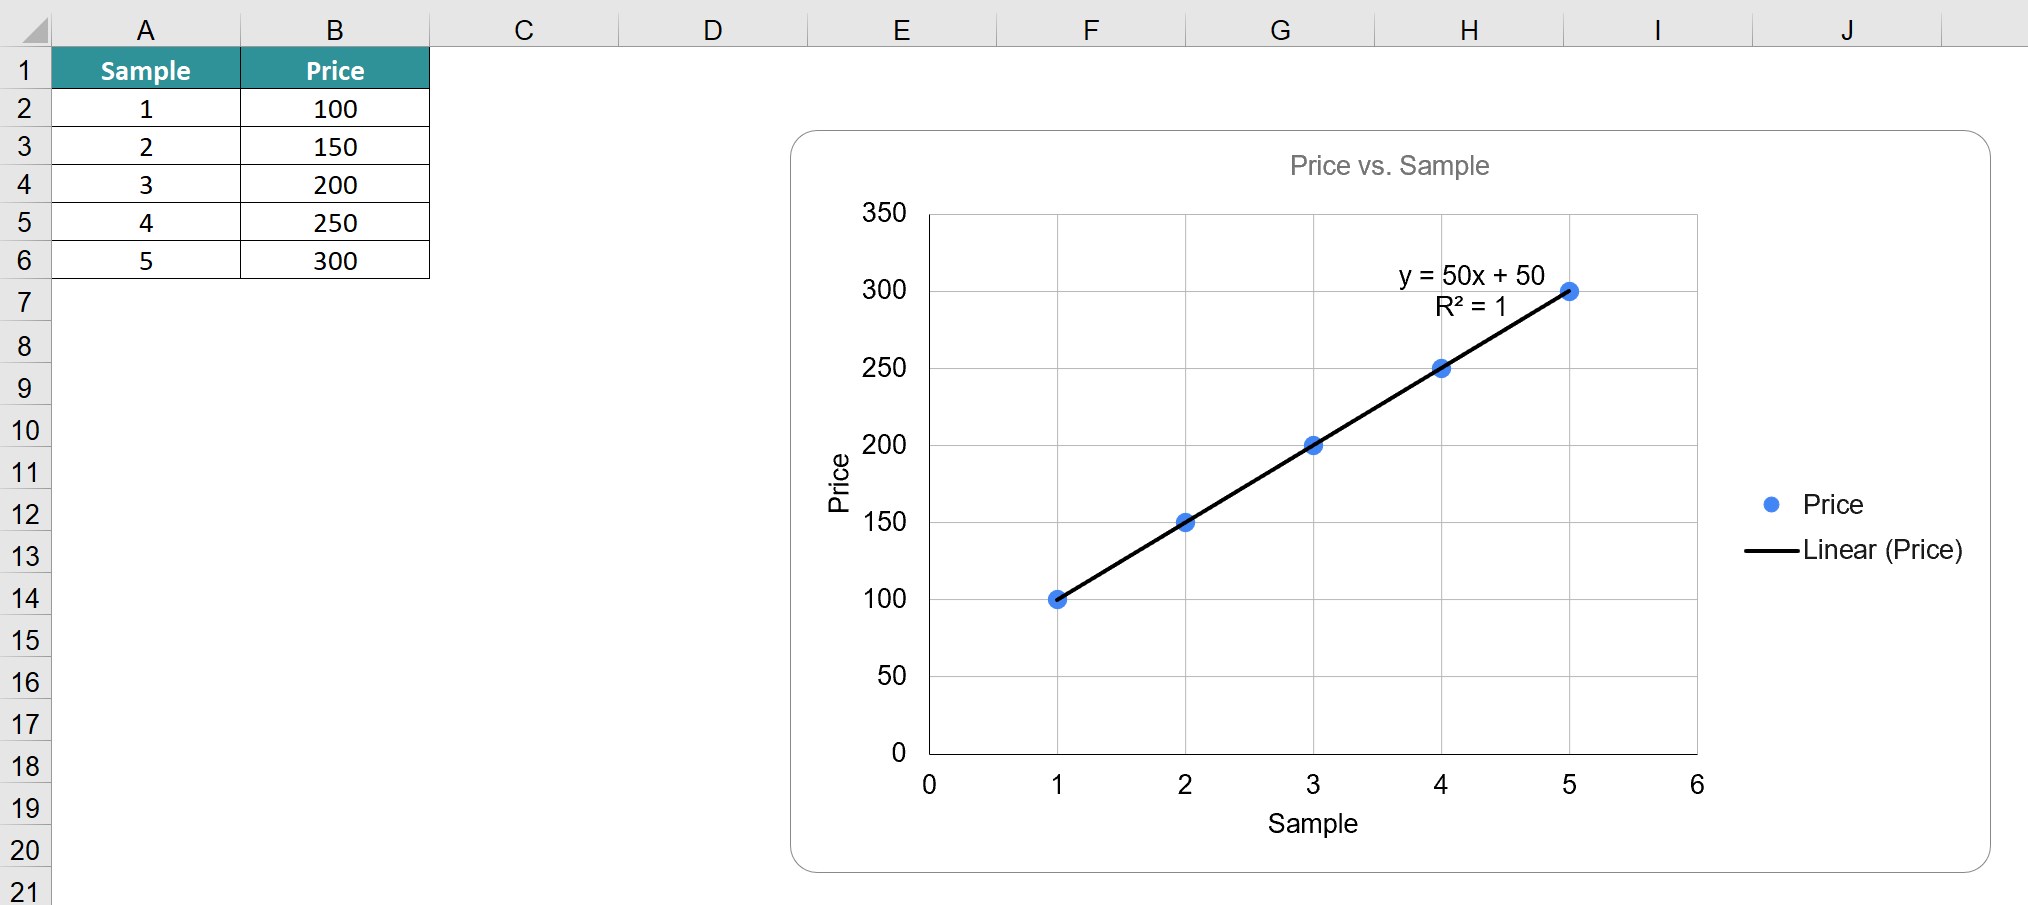
Likewise, we can create regression analysis.
LINEST function in google sheets is similar to the function in Excel and it derives the result of linear regression for the given data.
The formula of LINEST function in google sheets is =LINEST(known_y’s, [known_x’s], [const], [stats])
Use this Regression Analysis In Google Sheets Template to follow along with the examples in this article.
Download Excel Template