
What Is Sunburst Chart In Google Sheets?
Sunburst chart is a type of chart used to show the hierarchical levels as rings. It is a default chart type in Excel but unfortunately, sunburst chart in Google sheets is not an inbuilt chart type as bar chart, tree chart or table chart.
However, we can create sunburst chart with the help of add-ins. Before learning about add-ons, let us learn how sunburst chart appears. For example, consider the below table showing region, product and sales in columns A, B, and C, respectively.
Use this Sunburst Chart In Google Sheets Template to follow along with the examples in this article.
Download Excel Template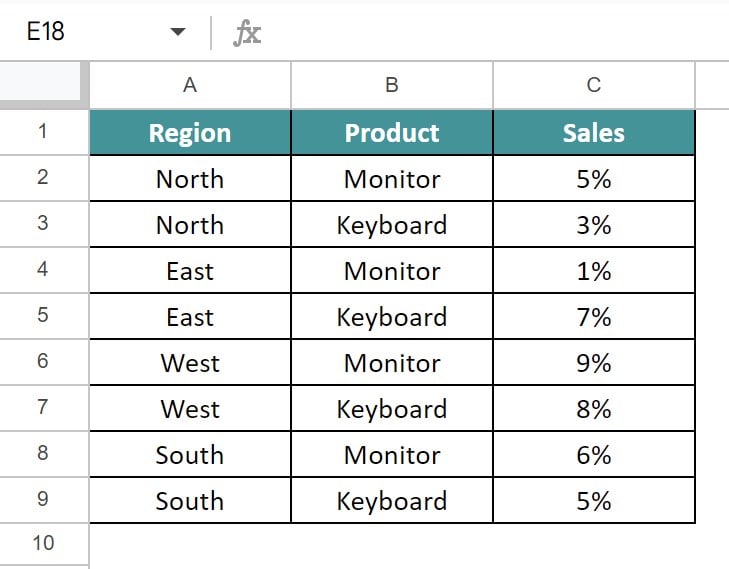
To begin with, insert the table in the spreadsheet. In this example, the table is inserted in the cell range A1:C9. Next, select the cell range. Now, click on Extensions and select the ChartExpo add-on. Now, click on Open. The ChartExpo tab appears at the right-end of the screen. Now, search for sunburst chart and select sheet and cell range in the tab, which we want to add in the chart.
Now, for the data, we can create a sunburst chart as shown in the below image.

In this article, let us learn how to use sunburst chart with detailed examples.
Key Takeaways
- Sunburst chart in Google sheets is a chart type which users can create to show the hierarchical positions.
- Remember, the sunburst chart in Google sheets is not available by default.
- We need to install an add-on to build sunburst Google sheets chart.
- Mostly, ChartExpo extension is used to create sunburst chart in Google sheets. Note that the free version comes with a watermark.
- In a sunburst chart, the inner ring shows the highest hierarchy and each of the outer rings show the sub-categories.
How To Build A Sunburst Chart In Google Sheets ?
We can build a sunburst chart in Google sheets with the help of ChartExpo add-on. The steps to install the add-ons are:
Step 1: First, open the Google Sheets spreadsheets. Click on Extensions.
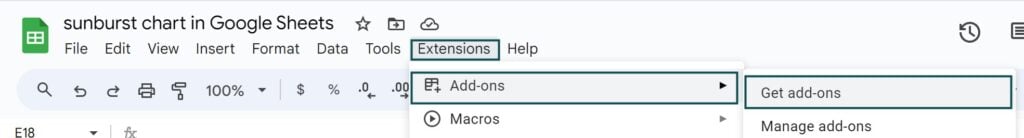
Step 2: Next, click on Add-ons and select the option. Get add-ons in the list of options that appear on the screen.
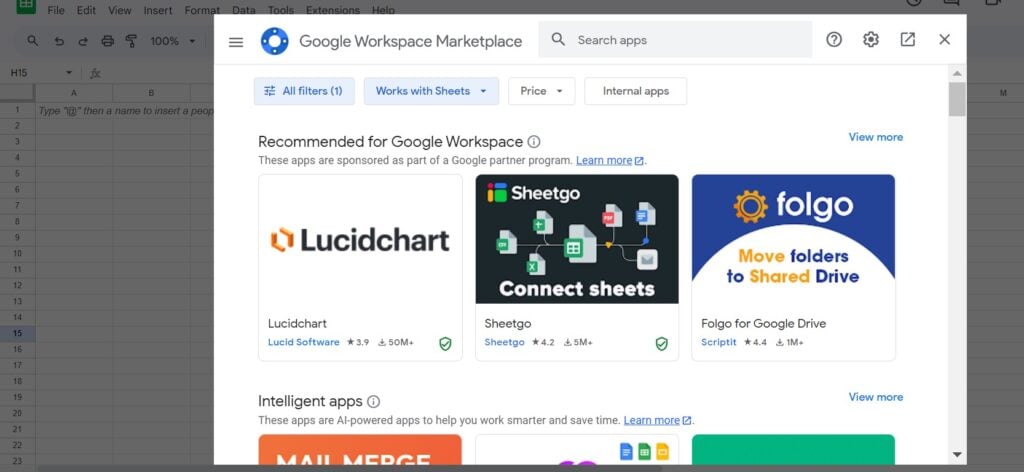
Step 3: The Google workspace tab appears.
Here, search for ChartExpo and click on install.
As soon as we install, we can see the add-on on under the Extensions tab, as shown in the below image.
Now, using the add-on, we can build sunburst chart.
Examples
Now, let us learn how to use the sunburst chart with below examples.
Example #1
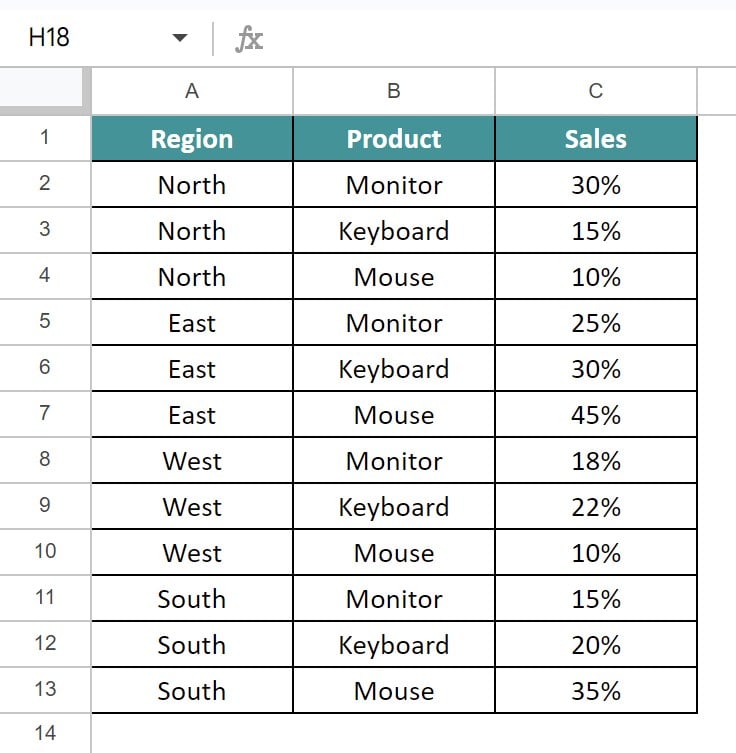
Consider the below table showing region, product and sales in columns A, B, and C, respectively.
Now, let us create sunburst chart.
The steps are:
Step 1: To begin with, insert the table in the spreadsheet. In this example, the table is inserted in the cell range A1:C13. Next, select the cell range.
Step 2: Now, click on Extensions and select the ChartExpo add-on. Now, click on Open.

Step 3: The ChartExpo tab appears at the right-end of the screen.
Step 4: Now, search for sunburst chart and select sheet and cell range in the tab, which we want to add in the chart.
We will be able to see the sunburst chart as shown in the below image.

Likewise, we can create the sunburst chart.
Example #2
Consider the below table showing region, product, availability and sales in columns A, B, C, and D, respectively.

Now, let us create sunburst chart.
The steps are:
Step 1: To begin with, insert the table in the spreadsheet. In this example, the table is inserted in the cell range A1:D13. Next, select the cell range.
Step 2: Now, click on Extensions and select the ChartExpo add-on. Now, click on Open.

Step 3: The ChartExpo tab appears at the right-end of the screen.
Step 4: Now, search for sunburst chart and select sheet and cell range in the tab, which we want to add in the chart.
We will be able to see the sunburst chart as shown in the below image.

Likewise, we can create the sunburst chart.
Example #3 – Format A Sunburst Chart In Google Sheets
Consider the below table showing name, region, and target starus in columns A, B, and C, respectively.

Now, let us create sunburst chart.
The steps are:
Step 1: To begin with, insert the table in the spreadsheet. In this example, the table is inserted in the cell range A1:C13. Next, select the cell range.
Step 2: Now, click on Extensions and select the ChartExpo add-on. Now, click on Open.

Step 3: The ChartExpo tab appears at the right-end of the screen.
Step 4: Now, search for sunburst chart and select sheet and cell range in the tab, which we want to add in the chart.
We will be able to see the sunburst chart as shown in the below image.

Now, to format, we need to use the ChartExpo tab and can change the hierarchy, inner rings, color etc, as shown in the below image.

Likewise, we can create the sunburst chart.
Important Things To Note
- Sunburst chart in Google sheets is a visualization chart used to show the data in a hierarchical view.
- It is not a default chart in Google sheets.
- To create or build sunburst chart, we need to install add-ons such as ChartExpo.
Frequently Asked Questions (FAQs)
For example, consider the below table showing country, event and participants in columns A, B, and C, respectively.
The steps are:
Step 1: To begin with, insert the table in the spreadsheet. In this example, the table is inserted in the cell range A1:C9. Next, select the cell range.
Step 2: Now, click on Extensions and select the ChartExpo add-on. Now, click on Open.
Step 3: The ChartExpo tab appears at the right-end of the screen.
Step 4: Now, search for sunburst chart and select sheet and cell range in the tab, which we want to add in the chart.
Now, for the data, we can create a sunburst chart as shown in the below image.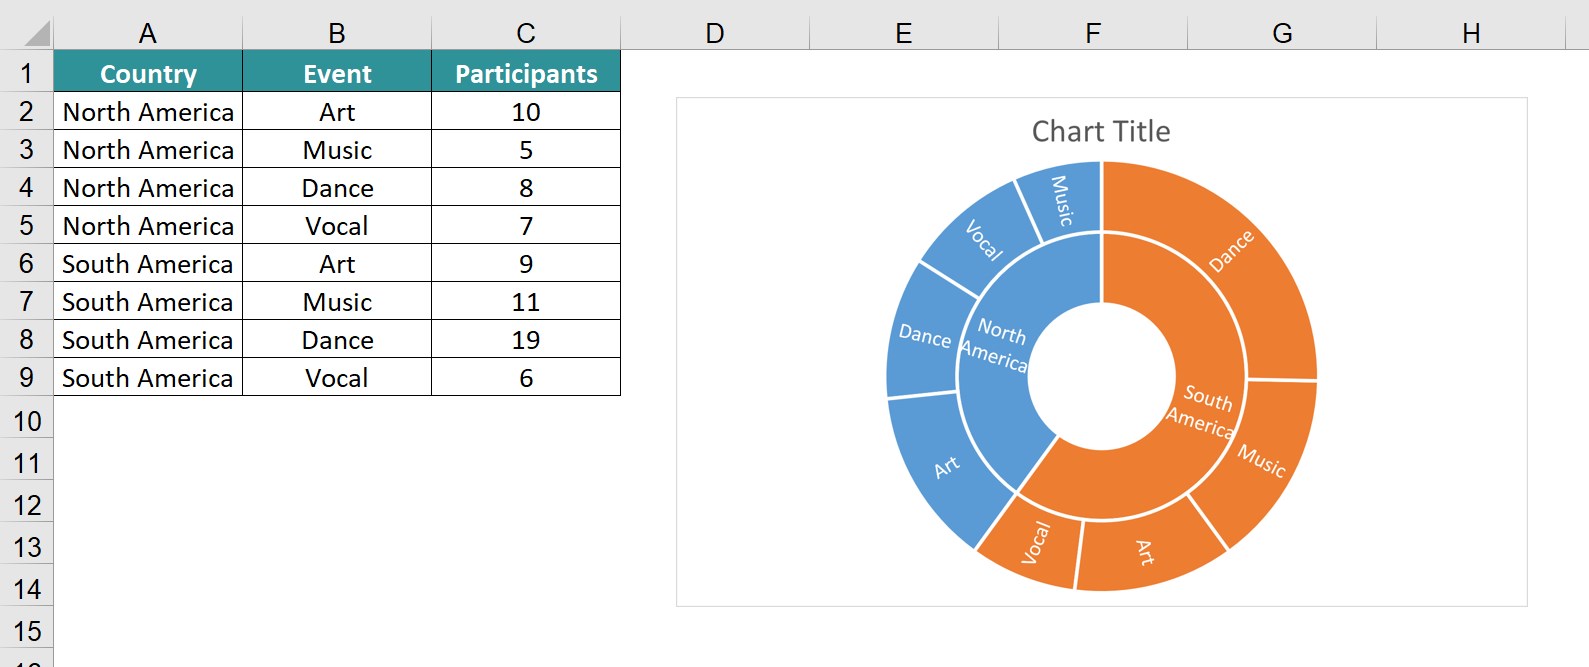
Likewise, using add-ons, we can create sunburst chart.
In Google sheets, we can create bar, line, column, stacked, tree map, table chart along with many other chart types. But, sunburst chart type is not available by default. Since this chart is available by default in Excel, we can create one right away in Excel but to create a sunburst chart, we need to install the ChartExpo add-on.
Using ChartExpo add-on, we can create many kinds of chart, along with sunbust chart in Google sheets.
The disadvantages of sunburst chart are:
• It takes time to create sunburst chart. We need to understand what kind of information we want to add in the chart.
• The chart may be a little confusing to understand. Therefore, we need to understand the angles and inner rings of hierarchy.
Use this Sunburst Chart In Google Sheets Template to follow along with the examples in this article.
Download Excel Template