
What is Tableau aggregate function?
Tableau aggregate function allows you to summarize or amend the granularity of your data. You can perform data aggregations, calculations, or grouping of values into a single value using aggregated functions. For example, you can use aggregate functions to calculate total sales across all the regions or average marks scored by students in a subject or median salary offered by companies in a college placement.
Tableau supports multiple aggregate functions to summarize data and perform data analysis. A sample Tableau aggregate function in Tableau view is provided below. This example displays Tableau aggregate data of the total quantity sold across the different regions.
SUM(Quantity Sold)

Use this Tableau Aggregate Template to follow along with the examples in this article.
Download Excel TemplateKey Takeaways
- Tableau aggregate function allows you to summarize or amend the granularity of your data.
- These functions are excellent tools for performing data aggregations, calculations, or grouping of values into a single value.
- There are multiple aggregate functions in Tableau such as SUM, VAR, PERCENTILE, MEDIAN, MIN, MAX, etc. using which you can perform Tableau aggregate data.
- You can create a Tableau aggregate calculated field to use the aggregate functions or use the Level of details (LOD) expressions.
- Consider the limitations of aggregate function in terms of usage with Tableau aggregate and non-aggregate data for calculations.
Types of Tableau Aggregate Functions
There are multiple aggregate functions available in Tableau that can be used for reporting purposes. These include:
#1 – AVG:
- This function returns the average value of an expression and ignores any null values in the data. Note this function accepts only numeric values.
- The syntax of the AVG function is AVG (expression)
Let’s understand this with a demo of this function. For this demo, we have used Marketing Campaigns Data, which contains the birth year, education, income, and amount spent on wine, fruits, gold, etc.
Step 1: Import the Marketing Campaigns Data into the Tableau interface.

Step 2: Drag and drop the Income and Education fields to the Columns and Rows shelf, respectively.

Step 3: Right-click on the SUM(Income) and choose Measure (Sum) – Average.

Step 4: Drag the Education field to the Color in Marks pane.

Step 5: Click on the Sort descending icon to display the average income by Education

You can also create a Tableau aggregate calculated field AVG(Income) to build this visualization.
#2 – COUNT:
- The COUNT function returns the total count of items, and it doesn’t include any null values
- The syntax of COUNT is defined as COUNT(expression)
In this example, we will demo using the aggregate function COUNT in Tableau view. We have leveraged the same Marketing Campaigns Data that we have used for demonstrating AVG aggregate function.
Step 1: Drag and drop the ID and Country fields to the Columns shelf and the Rows shelf, respectively.

Step 2: Right-click on ID and choose Measure – Count.

Tableau will automatically create a visualization in the view.

Step 3: Sort the visual in descending order by choosing the sort icon. It will display the total count of marketing campaigns made per country.

#3 – COUNTD:
- COUNTD function is similar to COUNT, but it returns the distinct or unique items in a group. It doesn’t count any null values.
- The syntax of the COUNTD function is COUNTD(expression)
In this example, we will demonstrate using the COUNTD aggregate function to calculate the distinct number of orders per customer. To demo this, we have leveraged superstore_dataset, which contains the comprehensive sales record from a superstore, containing 9,994 entries across 19 distinct fields and covering a variety of categories such as order details, anonymized customer information, product specifics, and financial metrics.
Step 1: Import the Superstore dataset into Tableau using the Fila Navigator.

Step 2: Drag and drop the Order Id and Customer into the Columns and Rows shelf, respectively. Tableau will automatically create a visual in the view.

Step 3: Drag and drop the Order Id to the Columns shelf. Right-click on the Order Id and choose Measure – Count (Distinct).

Now, you can see Tableau displays the total number of orders placed by customers vs. the distinct orders per customer.

#4 – CORR:
- CORR function returns the Pearson correlation coefficient of 2 expressions and measures the linear relationship between two variables.
- The output varies between -1 to 1, where 1 represents a positive linear relationship, 0 means no linear relationship between the variance, and -1 is an exact negative relationship.
- The syntax of CORR function is CORR (expression1, expression2)
To demo the CORR aggregate function, we have leveraged the Federal Tax Revenue by Source 1934- 2018 dataset, which contains the tax details across corporate income, excise, individual income, and others. The example demonstrates the Pearson correlation between the Corporate Income tax and Individual Income Tax.
Step 1: Right-click on the Data pane and choose the Create Calculated Field…

Step 2: In the dialog box, specify the logic for Correlation between the Corporate Income Tax and Individual Income Tax.

Step 3: Drag the calculated field to the Text in the Marks pane. As you can see, the CORR Taxes have a value of 0.9723 which means a positive correlation between these fields.

#5 – MAX:
- MAX function returns the maximum of the arguments, which is the same as the input data type
- It can accept a single expression or two expressions as input variables
- If any of the input variables have null values, then it returns null
- MAX function returns the values below
- For Strings, a value that comes last alphabetically in order
- For Dates, the latest or recent date
- For aggregated data, a single aggregated value
- For data comparison, the highest row-level value
- The syntax of MAX function is MAX(expression) or MAX (expression1, expression2)
In this example, we will understand how to use the MAX aggregate function in Tableau. For this demo, we used the superstore dataset, which contains the sales details across different product categories.
Step 1: Create a data visualization by dragging and dropping the Sales and Subcategory fields to the Columns and Rows, respectively.

Step 2: Change the aggregate function from SUM to Maximum by selecting Measure (Sum) – Maximum from the context menu.

Step 3: Sort the view by choosing the sort icon. Drag the Sales to the Label and change the aggregate function from SUM to Maximum in the Marks pane.

Step 4: Drag the Subcategory to Color in the Marks pane. Now, your visualization is ready to be viewed, where you can easily figure out the top sales across each product subcategory.

You can also apply the aggregate function to a string field. Here we have applied the MAX function to the Tableau aggregate string field Product Name.

#6 – MEDIAN:
- The MEDIAN function returns the median value of all the data and ignores any null values. It works with numeric data
- The syntax of the MEDIAN function is MEDIAN (expression)
In this example, we will show how to calculate the Median sales per product subcategory using the MEDIAN function.
Step 1: Create data visualization using the fields from the Data pane.

Step 2: Drag the Subcategory to Color in the Marks pane.

Step 3: Sort the visual in descending order using the sort icon.

Step 4: Change the aggregation from SUM to Median.

Step 5: Drag the MEDIAN(Sales) to the Label in the Marks pane.

Now, your visualization is ready. As you can see, the view displays the Median sales per product subcategory in Tableau.

#7 – MIN:
- MIN function returns the minimum or the lowest of the arguments, which is the same as the input data type
- It can accept a single expression or two expressions as input variables
- If any of the input variables have null values, then it returns null
- MIN function returns the values below
- For Strings, a value that comes first alphabetically in order
- For Dates, the earliest or first date
- For aggregated data, a single aggregated value
- For data comparison, the lowest row-level value
- The syntax of MIN function is MIN(expression) or MIN (expression1, expression2)
The example of the MIN function is similar to that of the MAX aggregate function.
Step 1: To use the MIN function in Tableau, drag Sales and Subcategory to the Columns shelf and the Rows shelf, respectively.

Step 2: Change the aggregation to Minimum.

Step 3: Sort the visual in descending order by clicking on the sort icon. The Tableau view will display the minimum sales value for each product subcategory.

#8 – SUM:
- The SUM function returns the sum of all the values in an expression, and it ignores any null values. It accepts only numeric values as input.
- The syntax of the SUM function is SUM(expression)
In this example, we have demonstrated how to use the SUM aggregate function in Tableau.
Step 1: Drag the fields to the Columns and Rows shelf. Here, we have dragged the Segment and Profit to Columns, whereas Region and Category to the Rows shelf.
For color-coding, we have dragged the Category to the Color in Marks pane.
Tableau view displays the total sum of profit across different product segments in each region and category.

Note: Instead of using these aggregate functions in the Tableau interface, you can also create calculated fields or level of details (LOD) for the Tableau aggregate data creation.
Important Things to Note
- Tableau aggregate function can’t be combined with any disaggregated value for aggregate calculations. For example, you can’t perform a calculation such as COUNT(Order Id) * Customer Id. However, COUNT(Order Id) * COUNT(Customer Id) is supported in Tableau.
- You can use constant values in an expression. For example, COUNT(Customer Id) *2 or COUNT(Customer Id * 2) both are supported in Tableau.
- Ensure that all the arguments or input parameters in Tableau to any aggregate function must be either aggregated or disaggregated. For example, MIN(AVG(Revenue), Net Profit) is incorrect expression whereas MIN(AVG(Revenue), SUM(Net Profit)) is a valid expression
- Any aggregate function always returns a measure value
- Any calculation involving aggregate functions is accurately calculated for grand totals
- You can perform nesting of aggregate functions for your complex dataset
- Consider the impact of aggregate function interaction with the filters in the Tableau visualization
Frequently Asked Questions (FAQs)
To use Tableau aggregate calculated fields, follow the steps below:
• Navigate to a new worksheet in Tableau. Right-click on the Data pane and select Create Calculated Fields…
In the Edit window, specify the calculation logic using the Tableau aggregated functions.
For example, to calculate the total unique orders count in your sales dataset, you can use COUNTD(Order Id).
Similarly, you can also use other aggregate functions such as SUM, AVG, MAX, MEDIAN, etc. for your Tableau aggregate calculated fields.
Level of Detail Expressions allow you to calculate at the data source and visualization level with a choice of flexible granularity i.e. more granular (INCLUDE), less granular (EXCLUDE), or entirely independent level (FIXED).
For example, you can use the aggregate function SUM to calculate the sum of revenue generated per product type using the FIXED level of detail expression:
{FIXED [Product Type]: SUM([Revenue Generated])}
Table calculations are a type of Tableau aggregate calculated field that calculates the local data available in the Tableau visualization. You can typically use these calculations for transforming the values into rankings, showing running totals, or showing percentages of the total, etc.
To use Tableau aggregate functions in Table calculations, right-click on the aggregate function and select.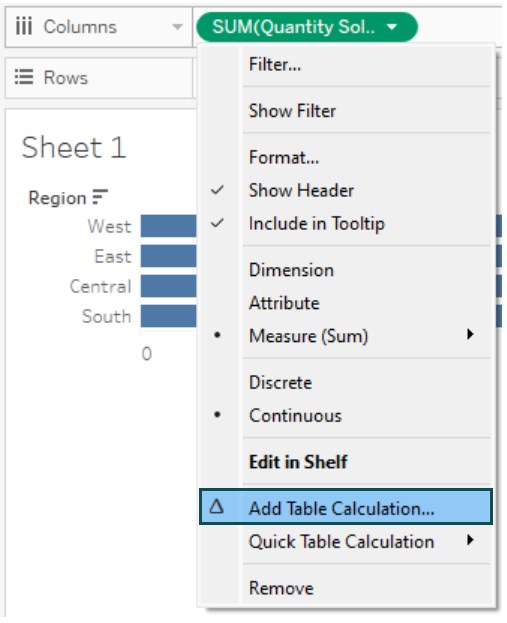
In the Table Calculation dialog box, select the Calculation Type as Percentile or any other aggregate function for your visual.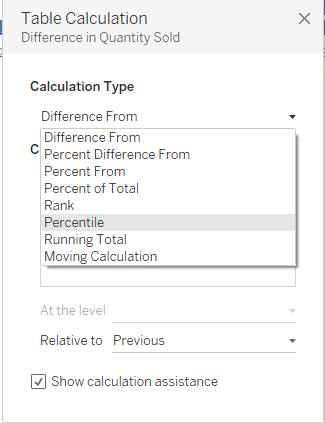
Tableau does not support creating custom aggregate functions natively. However, you can achieve some degree of customization using Level of Detail (LOD) expressions, table calculations, or Tableau aggregate calculated fields.
Use this Tableau Aggregate Template to follow along with the examples in this article.
Download Excel Template