What are the parameters in Tableau?
Parameters in Tableau are workbook variables that allow you to substitute a fixed or constant value with dynamic values in a calculation, filter, or reference lines. These variables can be numbers, dates, or string values that are used in Tableau. Parameters are extremely effective for cases where you desire to include dynamic interaction with the system, add flexibility in the calculation, or even assess the outcomes with what-if scenarios.
For example, you may create a calculated field that determines whether a student has passed or failed an examination based on the marks scored in that subject. The threshold mark for passing the subject can be 40%. You can eliminate this fixed number reference by creating a parameter and referencing the parameter value (you may define 45% or 50%) to decide whether the student has passed or failed. It allows you to change the criteria dynamically without any need to amend your calculations or underlying logic.
Let’s now look at how to create parameters in Tableau.
Table of contents
Key Takeaways
- Parameters in Tableau allow users to replace a fixed or constant value with dynamic values in a calculation, filter, or reference lines
- You can create a parameter in Tableau by specifying the parameter properties and allowable values such as All, List, or Range
- You can use these parameters for what-if scenario analysis and dynamic control of the values for your analysis
How to create parameters in Tableau?
To create parameters in Tableau, follow the steps highlighted below:
Step 1: Import the dataset into Tableau using the File – Open. Once the data is imported, open a new sheet by clicking on the New Worksheet icon.
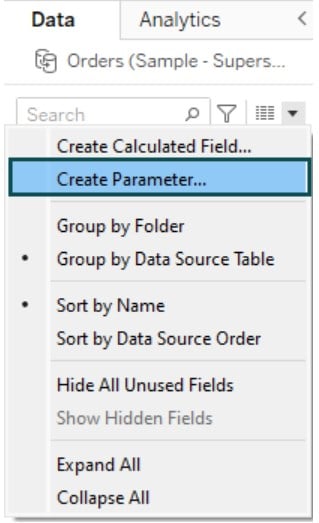
Step 2: In the worksheet, click on the drop-down arrow in the upper right corner.

Step 3: From the context menu, choose the Create Parameter option.
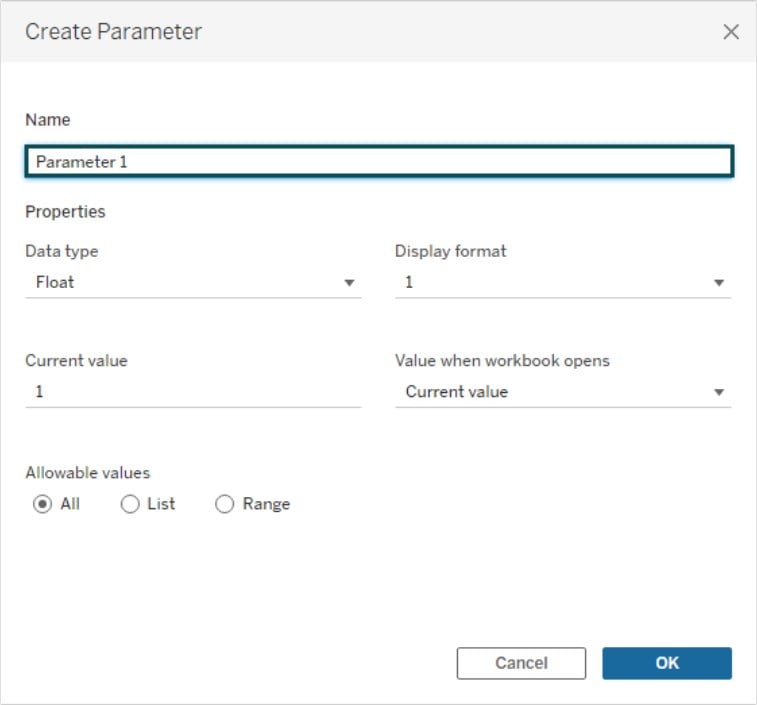
Step 4: In the Create Parameter dialog box, specify the parameter name.
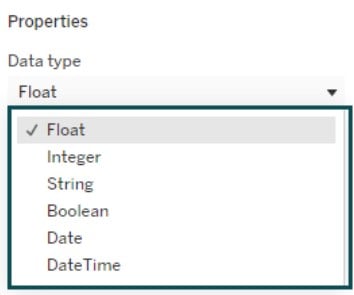
Step 5: Define the data type from the available list of options as shown below.
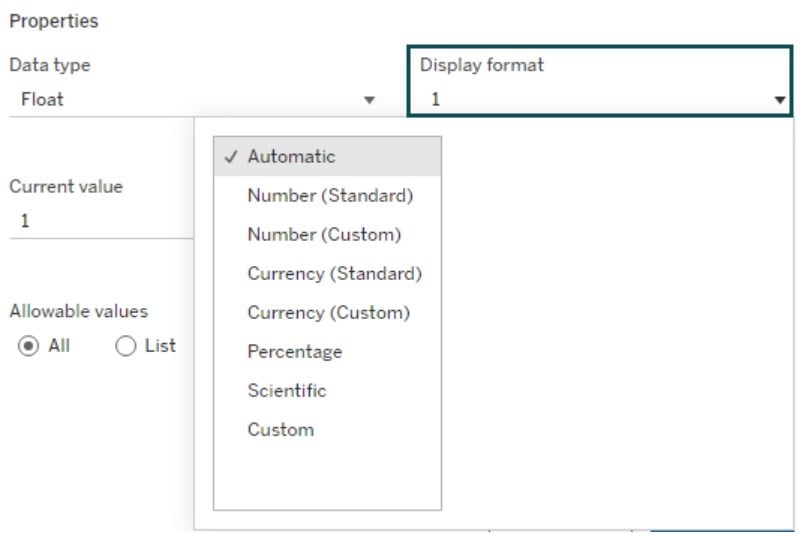
Step 6: Specify the display format by clicking on the drop-down arrow and choosing a format from the options.
Step 7: Choose an option from the Allowable values, i.e., All, List, or Range.
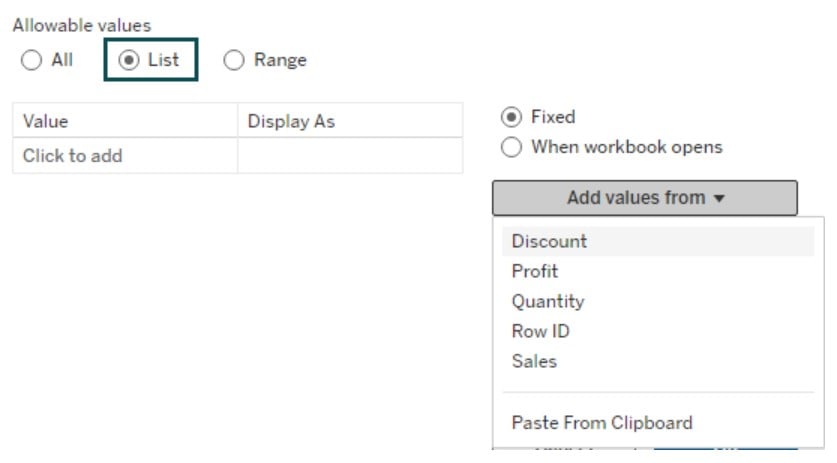
If your selection is List, then you must specify the values by using the Add values from the drop-down option.
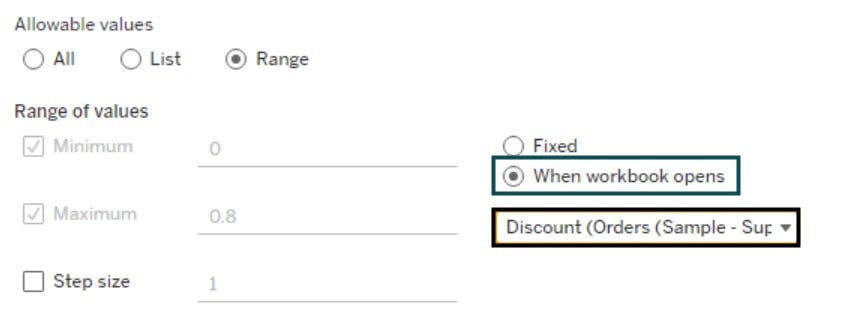
If your selection is Range, you need to provide the range of values, i.e., Minimum, Maximum, and Step size. You can also use the Add Values option in the drop-down menu to pick the values.
Note: The Step size allows you to control the jump between the values, such as enabling you to choose from 1,2,3 or move from 1 to 5 to 10, etc., depending on the value specified in the Step size.
You can specify the refresh options for the parameter’s list of values every time the workbook is opened in both List or Range. Select the When the workbook opens option and specify the data field.
Once completed, click on OK to save the changes. The newly created parameter can be seen in the viz in the Data pane.

Note: Tableau parameter multiple selection is not supported. If you are using a live data connection, you may use Tableau parameter custom SQL to specify the filter conditions. It is similar to the where clause in SQL query.
Examples
In this section, we will go through 3 different use cases demonstrating the creation of parameters in Tableau.
Example #1 – Parameters by Filter
In this example, we will demo creating parameters in Tableau and use them for filters. For this demo, we have used the US_Parking_Data dataset that contains detailed information on information about US parking such as Building State, Building Status, Property Type, Total Parking Spaces, and Owned/Leased.
To create parameters by Filter, follow the instructions below:
Step 1: Import the dataset using File – Open. Click on the New Worksheet icon to open a new sheet.
Step 2: In the Data pane, click on the drop-down arrow in the upper right corner and choose Create Parameter.
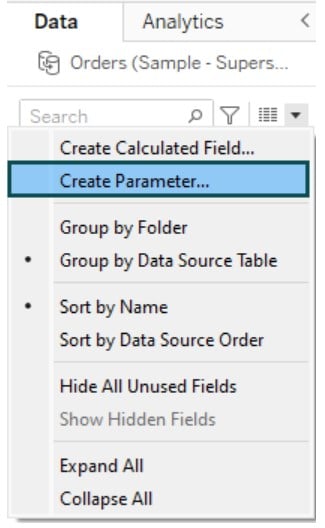
Step 3: In the Create Parameter window, specify the parameter name and Data type. Select the List option from the allowable values.
- Select the When workbook opens option and choose the data field to specify the list of values.
- Here we have selected Bldg Status in the list for the parameter we want to create.
- Once completed, click on the OK button.

It will create a new parameter in the viz.

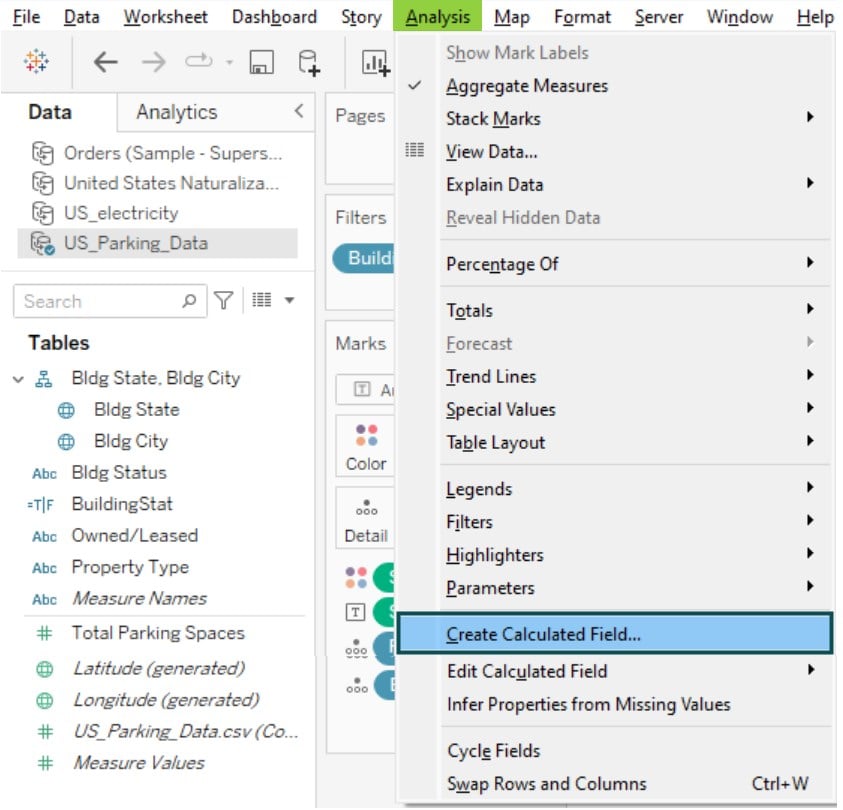
Step 4: Navigate to the Analysis – Create Calculated Field option from the context menu to create a Tableau parameter calculated field.
Step 5: In the calculated field window, specify the condition of the calculated field regarding the parameter created. Click on the OK button.

Step 6: Now drag and drop the dimensions to the Rows section and the newly created measure to the Marks section. It will create a visualization, as shown below.
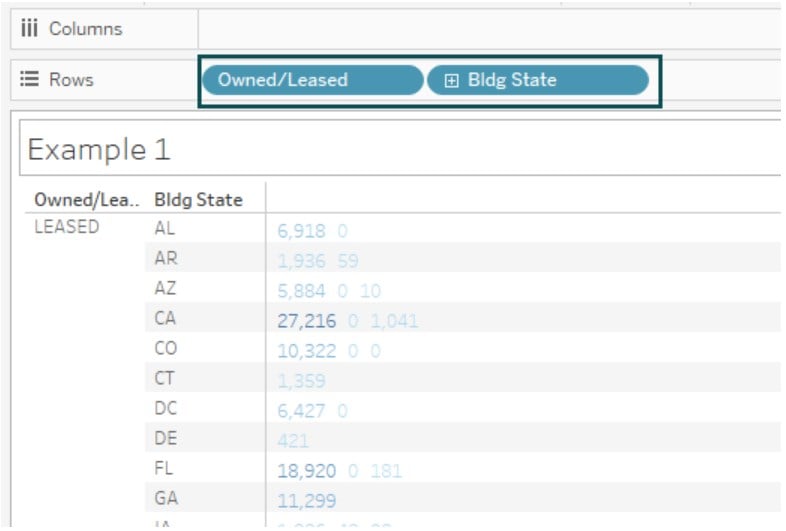
Drag and drop the calculated field to the Filters section. Choose the value from the list and click on Apply.

Step 7: Right-click on the parameter in the viz and choose Show Parameter.

It will show the parameter values.
Step 8: Change the value of the parameter from ACTIVE to DECOMMISSIONED. You will see that the visualization has changed based on your parameter value selection.

Example #2 – Parameters by Set
In this example, we will demonstrate creating parameters by set in Tableau. For this demo, we have leveraged the US_electricity dataset that contains information on sources of energy, their uses in different economic sectors, and the revenues obtained from the sale of electrical energy.
To create a parameter by set in Tableau, follow the instructions below:
Step 1: Import the dataset into Tableau Desktop using the File – Open navigation.
Step 2: Open a new worksheet by clicking on the New Worksheet icon and select the imported dataset available under the Data pane.
Step 3: Create a parameter in the viz using the steps highlighted in example 1. In this case, we have created a parameter Top N. We have specified the data type as Integer and selected Range as an allowable value. The range of values, such as minimum, maximum, and step size, have been specified as shown below.
Once the details are provided, click on the OK button.

It will create a parameter in the viz, as shown below.

Step 4: In the Data pane, select the dimension for which you want to create the set. Click on the drop-down arrow – Create – Set.

Step 5: In the Set window, click on the Top tab and choose By field. Select Top N from the drop-down. Click on the Apply button to save the changes.

Step 6: Drag and drop the newly created set to the Marks pane.

Step 7: Right-click on the parameter (Top N) and click on Show Parameter.
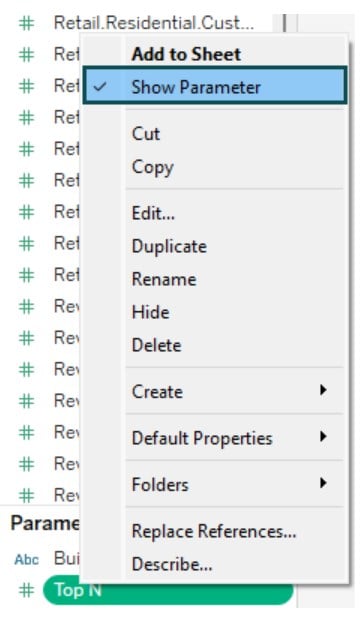
It will display the parameter values as shown below

Step 8: Drag and drop the dimension to the Columns section and the measure to the Rows section. It will create the data visualization as shown below

Note that as you change the Top N values, the visualization will be highlighted in different colors, as shown above.
Example #3 – Edit a Parameter
Now that we have learned to create parameters for our visualization purpose let’s look at how you can edit a parameter. We will demonstrate this using the United States Naturalization dataset. The United States Naturalization dataset contains data on the number of naturalizations in the United States from 1999 to 2017, categorized by year, type, country, or region, and the number of naturalizations. Follow the instructions outlined below to edit a parameter in Tableau:
Step 1: Import the dataset to Tableau using the File Navigator.
Step 2: Create a new worksheet and create a parameter in the viz using the steps outlined in previous examples.
In this case, we have created a Type Parameter by specifying the properties as shown below. This is a List parameter with values mapped to the Type dimension in our dataset.
Click on the OK button once the changes are done. Once done, you can see the parameter in the viz.
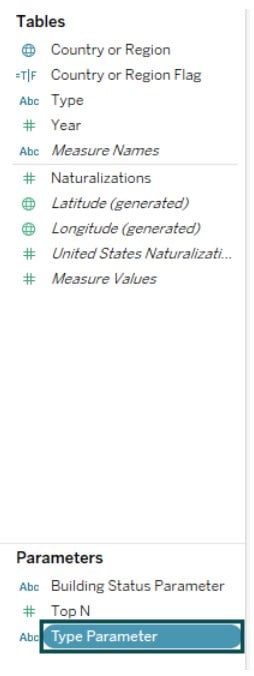
Step 3: Create a Tableau parameter calculated field referencing this parameter by navigating to Analysis – Create calculated field. Click on the OK button to save the changes.
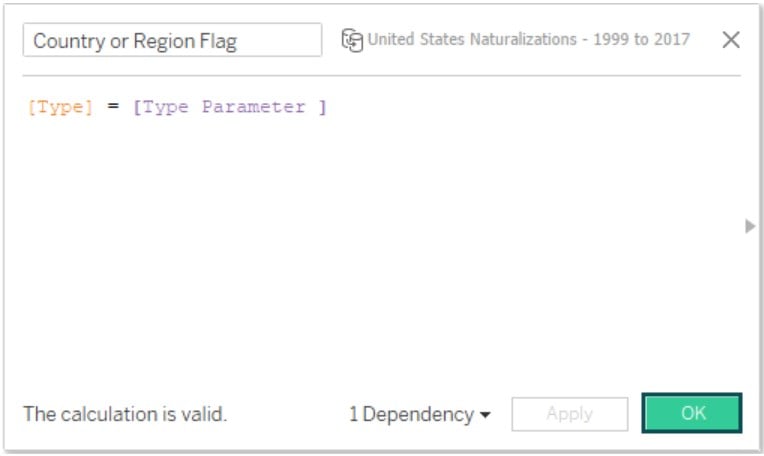
Step 4: Drag and drop the dimensions and measures to the Rows and Columns section to create data visualization.
Step 5: To edit the parameter, right-click on the parameter in the viz and select the Edit option.
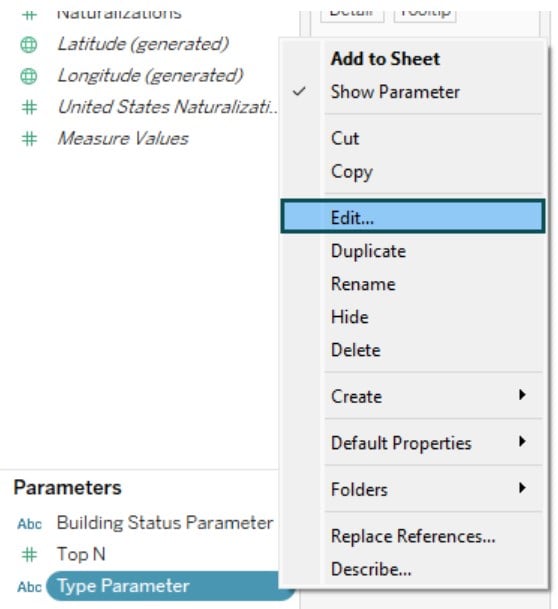
Step 6: Amend the changes as needed and click on OK to save the changes.
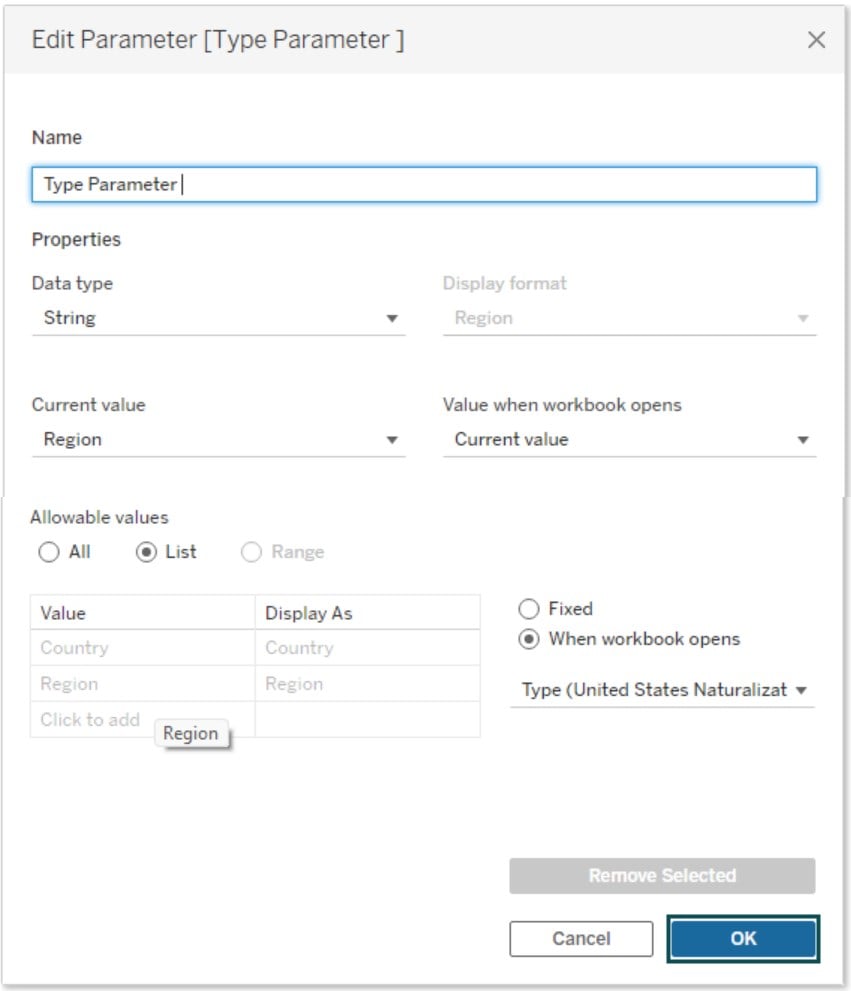
You will see the changes to your visualization as per the amendment to the parameter.
Parameters in Tableau vs. Filters in Tableau
The key differences between the parameters vs filters in the tableau are highlighted below:
| Items | Parameters | Filters |
|---|---|---|
| Definition | These are workbook variables that allow users to control the input values dynamically over a fixed or constant value in a calculation, filter, or reference lines | Filters are conditions that can be used to restrict the dataset for visualization or analysis purposes based on specific conditions or criteria |
| Objective | The key objective is to allow user interactivity and flexibility and enable perform what-if scenario analysis through dynamic input values | The key objective is to limit the dataset by applying certain conditions to enable users to perform operations on the limited dataset to perform faster calculation or analysis |
| Usage | Primarily used in calculations, filters, or reference lines to create customized visualization or data analysis | Helps users to constrict the dataset to a small subset which can be further used for data operations |
Note: You can use tableau Parameter actions to trigger events based on your interactions with reports.
Important Things to Note
- For String data type parameters, Range values are not supported
- Tableau parameters are specific to workbooks.
- Consider using meaningful names for the parameters
Frequently Asked Questions (FAQs)
Tableau supports the below types of parameters that you can create. These include:
• Float: Allows specifying the decimal values
• Integer: Use this type for whole numbers
• String: Enable you to specify the text values
• Boolean: You can specify the True/False evaluation
• Date: Allows defining the date values
• DateTime: Enables to specify the date and time values
You can specify both static and dynamic parameters in Tableau. When you specify static parameters, the values are fixed in nature and remain in effect till it’s manually edited. Dynamic parameters allow you to change the values on the fly and hence enable user interaction during the data analysis.
You can follow the steps below to change the date aggregation using the parameters.
• Create a parameter using the data type as Date or Datetime and the related values i.e. Daily, Weekly, Monthly, etc.
• Create a Tableau parameter calculated field by referencing the parameter
• Use the calculated field in your data analysis or visualization.
This will ensure that when you interact with your visuals, the calculation will reference the parameter values, and date aggregation will change dynamically.
To make a what-if analysis using parameters, follow the instructions below:
• Create a parameter by specifying the parameter properties.
• Create a Tableau parameter calculated field by referencing the parameter created in the previous step.
It will ensure that every time you adjust the values of the parameter, the calculated field value will also be regenerated.
Recommended Articles
This has been a guide to Tableau Parameters. Here we explain how to create and use parameters in Tableau with examples & points to remember. You can learn more from the following articles –

Leave a Reply