
What is the Tableau Reference Line?
Tableau Reference Line is a horizontal line that can be added to any continuous axis in the Tableau view to identify a specific value, region, or range. These reference lines help you to perform data analysis and identify how the data points are distributed compared to the reference line. For example, if you add a reference line to the average marks of students, you will be able to understand how each of the students has fared compared to the average marks of the class.
You can add as many reference lines as you want to the Tableau view. A typical Tableau reference line looks like the one highlighted below where you can display both line and confidence intervals for the view.

Use this Tableau Reference Line Template to follow along with the examples in this article.
Download Excel TemplateKey Takeaways
- Tableau Reference Line is a horizontal line you can add to any continuous axis to identify a specific value, region, or range.
- These lines help users identify the data distribution in comparison to a benchmark value
- Tableau supports two types of reference lines, i.e., fixed value and computed value on the axis.
- You can create or add a reference line by dragging the Reference line under the Analytics tab to the view.
- Tableau reference lines can be added to the Entire Table, Per Cell, or Per Pane basis.
- Specify the aggregations you want to base for your reference line.
- Reference lines can be based on calculated fields or parameters and work with a majority of the visualizations in Tableau.
Types
There are different types of Tableau reference lines that you can add to your view. These include:
- Reference line at a constant value on the axis
- This refers to a fixed value to define the reference line for your data comparison
- A reference line on a computed value on the axis
- This refers to the calculated value for defining the reference line to your view.
You can also include a confidence interval with a reference line with different values such as 50, 80, 90, 95, 99, 99.5, and 99.9 to your view.
How to Create or add a reference line in Tableau?
To create or add a reference line in Tableau, follow the steps below:
Step 1: Connect your dataset to the Tableau interface.
Step 2: Create a data visualization in the Tableau view using the imported dataset.

Step 3: Navigate to the Analytics tab. Drag the Reference Line under the Custom section to the view.
Tableau will display three different choices for the Reference Line. These include Table, Pane, and Cell, as shown below.

The difference between Table, Pane, and Cell is as shown below:
Table: Enables you to add a reference line to the entire table across all the panes

Pane: This enables you to add a reference line to each pane. In this case, there is a single pane, and hence, the reference line for the Table and Pane are the same. Calculations are performed within each pane for computed reference lines.

Cell: Enables you to add a reference line within each cell. Calculations are performed within each cell for computed reference lines.

Step 4: When you drag the Reference line to the view, you will see a dialog box. Specify one of the options, i.e., Entire Table, Per Pane, or Per Cell under Scope. The line option is, by default, selected on the screen.

Step 5: Choose a continuous field from the Value field. It will be used as a basis for your reference line. It provides an option to create a new parameter in Tableau and use it in the Value field.

Also, specify the aggregation by choosing an option from the drop-down menu. You can also create a Tableau reference line based on the calculated field by selecting the calculated field from the Value dropdown. Ensure that you have correctly defined the aggregation for the calculated field.
In the next section, we will cover in detail the different aggregation options available for the reference line.
Step 6: Select an option for Label. It will enable you to specify how you want to label the reference line.

| Options | Description |
|---|---|
| None | It will not display any label on the reference line |
| Value | It will display a label corresponding to the line’s value on the axis |
| Computation | This option will show the continuous field you have based on the reference line and the computed value. |
| Custom | Use this option to apply any custom label |
Step 7: Select an option for the Tooltip to display the tooltip in the view.

| Options | Description |
|---|---|
| None | This will not display any tooltip for the reference line |
| Automatic | This will display a default tooltip for the reference line |
| Custom | Use this option to build a custom tooltip |
Step 8: Provide an option to display your reference line. The choice you can make is whether to display only a line or a combination of line and confidence interval or only confidence interval. For choices involving confidence intervals, you can specify the interval parameter.

Step 9: Specify the formatting options for the reference line.

Also, you can specify any color coding for above and below the reference line. Tableau provides various options for defining the reference line label position as shown below.
Once you have specified the options in the Edit Reference Line, Band, or Box screen, your chart will look like the one provided below.

Note: In certain scenarios, you may observe the Tableau reference line not working. To fix such issues, the following troubleshooting options can be considered. These include:
- Ensure you are not using any transparent color-coding or thin-line
- Check if the reference line is compatible with the type of visual you are using
- Make sure the configuration is accurately defined
Aggregations Present for the Reference Line
There are multiple aggregations present for the reference line as mentioned below

| Aggregation Options | Description |
|---|---|
| Total | This option selection puts a line at the aggregation of all values depending on the choice of scope (Entire table, Per Pane, or Per Cell).This option is useful for the calculation of weighted average or custom aggregation |
| Sum | This selection puts a line at the Sum of all values as per the choice of scope |
| Constant | This selection puts a line at the specified value on the axis |
| Minimum | This choice places the reference line at the minimum value |
| Maximum | This choice places the reference line at the maximum value |
| Average | This selection puts a line at the mean value along the axis |
| Median | This selection puts a line at the median value along the axis |
Examples
In this section, we will go through different examples demonstrating the Tableau Reference Line.
Example #1 – Label Reference Line
In this example, we will demo adding labels to the Tableau reference line using the AAL_Sales dataset. The AAL_Sales dataset comprises the sales details of AAL, which is a household name in Australia. It is known for its clothing business and broadly caters to all groups— kids, women, men, and seniors.
To add a label to the Tableau reference line, you may follow the instructions outlined below:
Step 1: Connect with AAL_Sales to Tableau using the file navigator. After a successful import, you will see the dataset in the Data Source tab.

Step 2: Drag Time and Group to the Columns shelf and Sales to the Rows shelf.

Step 3: Navigate to the Analytics tab and drag the Reference Line to the view. Tableau will display three options, i.e., Table, Pane, and Cell.

Step 4: Once you drop the Reference Line into the view, Tableau will display the Edit Reference Line, Band, or Box window.
Specify the scope (here we have selected Per Pane), Value as SUM(Sales), Average, Label as Computation, and Tooltip as Automatic. You can see that Tableau has added an average reference line per the specifications you provided.

Step 5: Select the Line and confidence interval and specify the confidence interval as 99.9.
Tableau will add a confidence interval to the view, as shown below.

Example #2 – Format Reference Line
In the previous example, we have already demonstrated how to label the reference line. In this example, we will build upon example 1 to demo the formatting of reference lines using the same AAL_Sales dataset.
To format a Tableau reference line, follow the below steps:
Step 1: Open the Tableau reference line created previously in Tableau
Step 2: Right-click on the vertical axis, i.e., Sales axis in Tableau. Select the Edit Reference Line from the context menu.

Tableau will display the Edit Reference Line, Band, or Box window.

Step 3: Click on the Line drop-down and specify the choice of colors and line formatting options as shown below.

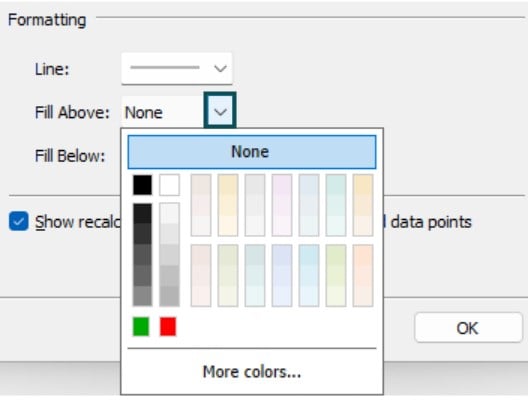
Step 4: Click on the Fill Above dropdown and specify the choice of color. Here, we have selected green as shown.

Step 5: Repeat the same process to define the choice of colors for Fill Below.

Now, your formatted Tableau Reference Line is ready for visualization.

Example #3 – Remove Reference Line
In this example, we will demonstrate how you can remove a reference line using the exact visualization we created in previous examples. It will help you clearly understand the steps involved.
To remove an existing reference line, follow the steps outlined below:
Step 1: Right-click on the vertical axis, i.e., the Sales axis in Tableau. Select the Remove Reference Line from the context menu.
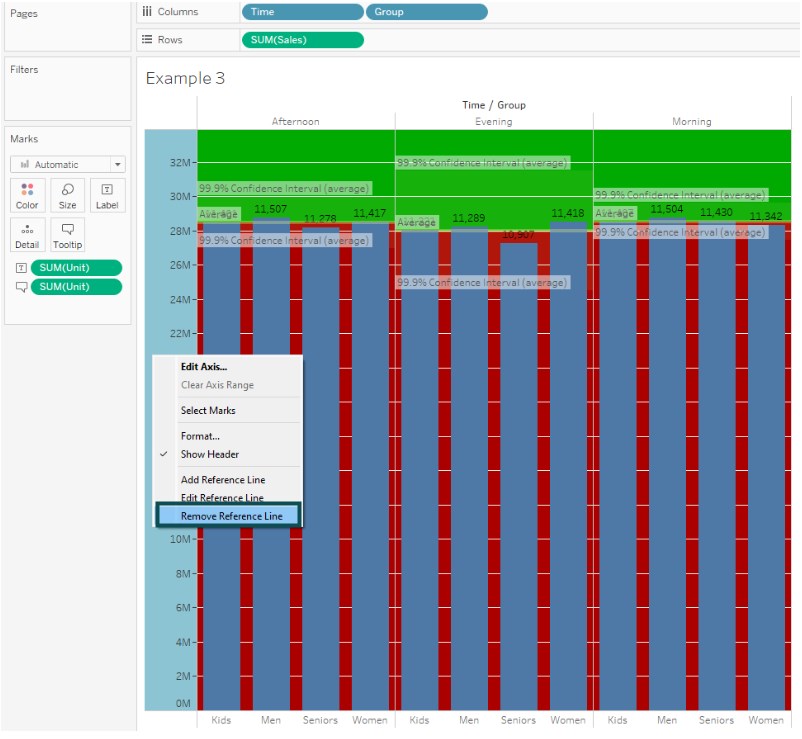
Once you select the option, Tableau will remove the existing reference line from your view as shown below.

Important Things to Note
- Tableau Reference Line can be a handy tool to analyze data patterns and compare performance against a benchmark such as average, total, or any other reference.
- You can apply Tableau Reference Lines to different chart types, including bar charts, bullet graphs, histograms, scatter plots, and many more.
- You can create as many reference lines as you want for your view.
- Consider providing clear labeling, color-coding, or other customized formatting to create user-centric and visually appealing Tableau views.
- Specify the aggregations and choice of line or confidence intervals to your view for a better representation of the visuals.
Frequently Asked Questions (FAQs)
The behavior of reference lines may or may not be changed with filters in Tableau. It depends on whether you have chosen the Reference line at a constant value or computed value on the axis. If constant value is chosen then there won’t be any impact of filters to it. However, for the computed value option, the reference line will adjust automatically to align with filtered data. For Drill-downs, the reference line behavior doesn’t change in Tableau.
Yes, you can add reference lines in Tableau based on calculated fields or parameters. You can choose the continuous field or create a new parameter from the Value drop-down as shown below.
No, reference lines don’t work with all types of visualizations in Tableau though a majority of the visuals are compatible with reference lines. For reference lines to work, you need a visual with continuous fields or axes. So, these lines can be created for charts such as bar charts, histograms, bullet graphs, line charts, scatter plots, etc.
Yes, reference lines support interactivity in a limited capacity in Tableau dashboards. You can use parameters as a basis for your reference line to include a level of interaction in the dashboard.
Use this Tableau Reference Line Template to follow along with the examples in this article.
Download Excel Template