


Introduction to Excel Forecast Sheets with AI predictive Confidence Bands
Forecasts without a measure of uncertainty feel incomplete. Finance teams often produce single‑line projections and then argue over plausibility, while stakeholders want to know how wide the range of likely outcomes is. Excel Forecast Sheets AI predictive confidence bands brings statistical rigor to the familiar Forecast Sheet workflow by estimating confidence intervals, showing predictive bands visually, and helping analysts interpret range‑based risk for planning and reporting. The AI layer simplifies choice of model, suggests reasonable band widths, and creates ready‑to‑use charts so analysts can focus on assumptions rather than model‑tuning.
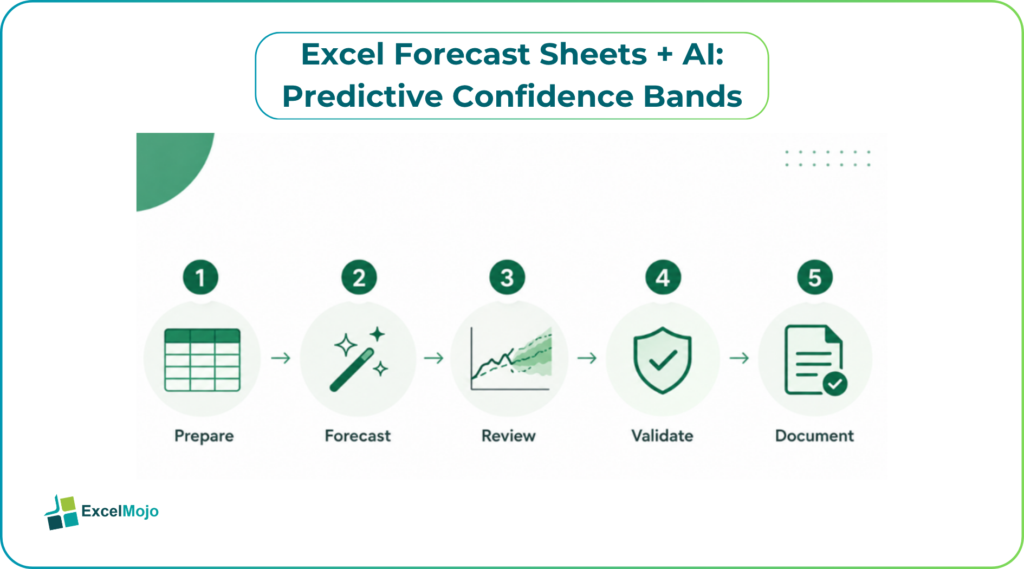
This article explains how to prepare time series for Forecast Sheet analysis, how AI can add predictive confidence bands and choose an appropriate interval method, and how to validate and document the results. Readers will find a step‑by‑step example, simple formulas for verification, and governance tips to keep forecasts auditable and defensible.
How Excel Forecast Sheets Work and Where AI Adds Value
Excel’s Forecast Sheet uses exponential smoothing to produce point forecasts and an optional confidence interval based on historical residuals. The built‑in chart gives a quick visual but does not always guide parameter choices or the interval method for irregular series. AI predictive bands Excel Forecast Sheets augment this by analyzing seasonality, trend, and noise, recommending appropriate confidence levels and offering alternative interval calculations such as bootstrapped residuals or analytically derived standard errors. The AI also suggests whether to transform the series before forecasting to stabilize variance, which improves interval accuracy for heteroskedastic data.
Preparing Your Data and Choosing band Methods
Clean inputs and a clear error model are prerequisites for meaningful bands.
- Data hygiene: ensure a clean time index with no duplicate dates, fill structural gaps explicitly, and convert text dates to true date values.
- Stabilize variance: inspect residuals for variance that grows with level; if present, apply a log transform and back‑transform forecasts to compute asymmetric bands.
- Band methodology choices: the standard Forecast Sheet interval uses approximate normal errors and historical residual scaling, but AI can recommend bootstrapping residuals for small samples, or predictive intervals from a state‑space model when seasonality is complex. Document the choice and the confidence levels used.
AI helps by scanning the series, flagging heteroskedasticity, and recommending transform and band methods. Analysts should accept the recommendation, test it on hold‑out data, and include both point forecasts and band assumptions in the model documentation.
Step‑by‑step: Create Forecast with AI Suggested Bands
A practical workflow keeps the forecast auditable and easy to validate.
- Prepare the series in a table with Date and Value columns. Confirm the periodicity (daily, weekly, monthly) and remove or label any outliers to be treated separately.
- Ask the AI or follow its recommendation to create a Forecast Sheet with 80% and 95% predictive confidence bands. If AI recommends a transform, apply it in a helper column and forecast the transformed series.
- Generate the forecast and examine the band widths across the horizon. Wider bands are expected further out; if bands shrink, re‑check model assumptions.
- Validate the predictive bands using a back‑test: hold out the last k periods, fit the model on the remaining data, and compute the coverage rate of the bands (proportion of hold‑out observations within the predicted interval). Coverage should approximate the nominal confidence level (for example, ~95% inclusion for a 95% band).
- Document the transformation, band method, and back‑test results in an audit sheet that sits with the workbook.
For many series, the AI will suggest bootstrapped residual bands if residuals are non‑normal, or analytic bands when residuals are homoskedastic. The back‑test step is the definitive check of band reliability.
Quick Validation Formulas and Checks
Simple formulas help confirm the intervals are meaningful for Excel forecast sheets with AI.
- Coverage test: if ForecastLow and ForecastHigh are band columns for the hold‑out, compute CoverageRate = COUNTIFS(HoldoutValues, “>= “&ForecastLowRange, HoldoutValues, “<=” &ForecastHighRange) / COUNT(HoldoutValues). Compare it to nominal levels.
- Mean absolute scaled error (MASE): use MASE to compare model accuracy across series; MASE = MAE / MAE(naive). This helps select the best model for band construction.
- Back‑cast residual analysis: compute residuals on training period and test for autocorrelation using simple ACF checks; strong autocorrelation implies the need for a state‑space model or block‑bootstrap for interval estimation.
AI can produce these formulas and the code snippets for back‑testing, reducing the manual math copy errors and helping analysts produce reproducible validation tables.
Practical Example: Monthly Revenue Forecast
A scenario illustrates the end‑to‑end flow Excel forecast sheets with AI.
- Data: monthly revenue for 48 months. The series shows seasonality and increasing variance. AI recommends a log transform and a state‑space model with bootstrapped residuals to compute predictive bands.
- Process: the analyst creates a transformed Forecast Sheet, computes point forecasts, and requests 80% and 95% bands using the bootstrapped residual method. AI provides the band columns and a chart with shaded bands.
- Validation: hold out the last 6 months, recompute forecasts on months 1–42, and evaluate coverage. The 95% band contains 5 of 6 hold‑out points, which is acceptable for small samples. The analyst documents the transform, the bootstrap seed, and the coverage results in an audit sheet.
This practical pattern reinforces that AI suggestions speed the setup, but validation must confirm the nominal coverage.
Pitfalls and Best Practices
- For Excel forecast sheets with AI, small samples and extreme volatility reduce interval reliability; prefer bootstrapping and conservative band widths for short series.
- Back‑test coverage is essential; never publish bands without empirical validation against hold‑out data.
- Be explicit about transforms and back‑transform bias; use median forecasts for log back‑transformation to reduce skew bias where appropriate.
- Archive seeds and parameters for any randomization (bootstrap seeds) so results are reproducible during audits.
Following these practices balances automation gains with statistical rigor and auditability.
Frequently Asked Questions (FAQs)
How do confidence bands change if the series is heteroskedastic?
If variance grows with the level, bands computed on the original scale can be misleading. Apply a variance‑stabilizing transform such as log or Box‑Cox before forecasting. After back‑transform, present asymmetric bands and document the transform and bias correction method used.
What is the best band method for small samples for Excel forecast sheets with AI?
For small samples, bootstrapped residuals or block bootstrap techniques often give more realistic bands than analytic normal approximations. Bootstrapping resamples training residuals to preserve empirical error structure and is especially useful when residuals are non‑normal.
How should an analyst validate predictive bands?
Perform a hold‑out back‑test: fit the model on historical data excluding the last k periods, forecast those periods, and compute the empirical coverage rate. Compare the observed coverage to the nominal confidence level and adjust band methodology if coverage is poor.
Can AI replace statistical validation in forecasting?
AI can recommend transforms and band methods, and it can generate validation code, but the analyst must run the back‑tests, interpret coverage results, and decide whether band assumptions are defensible. Human oversight remains necessary for model selection and governance.