
What Is NPV Function in Google Sheets?
The NPV function in Google Sheets calculates the net present value of a sequence of periodic cash flows that are based on a constant discount rate. It is used in financial analysis to determine whether an investment is profitable. NPV assumes that all cash flows occur at regular intervals (e.g., annually, monthly), unlike XNPV, which assumes irregular cash flows. It can be used to compare investments or projects with consistent return patterns.
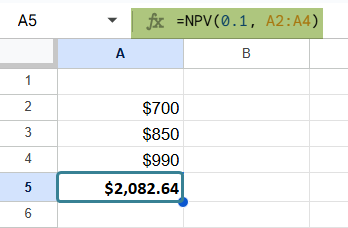
Let us understand it with a simple example. Suppose a person is investing in a project that gives returns every year for 3 years: $700, $850, and $990. If the discount rate is 10%, he can use the formula as shown below:
Use this NPV in Google Sheets Template to follow along with the examples in this article.
Download Excel Template=NPV(0.10, A2:A4) to calculate the present value of those future cash flows. This result shows him how much those future earnings are worth in today’s terms, helping him make better investment decisions.
Key Takeaways
- NPV in Google Sheets calculates the net present value of future cash flows that occur at regular intervals, using a constant discount rate.
- The function is commonly used to evaluate the profitability of investments, projects, or financial decisions with evenly spaced cash flows.
- The syntax for the NPV function is:
=NPV(rate, value1, [value2, …]) - NPV assumes periodic cash flows—such as annually, monthly, or quarterly—and does not consider the actual dates of those payments.
Syntax
Let us look at the syntax of the function to find the net present value for regular (periodic) cash flows.
The NPV formula in Google Sheets is as follows:
=NPV(rate, value1, [value2, …])
- rate: The discount rate or expected rate of return per period. It is expressed as a decimal. For instance, 6% is written as 0.6.
- value1, value2, …: These are the periodic cash flows. Outflows are entered as negative values, and inflows as positive values.
NPV assumes that the cash flows happen at evenly spaced intervals, such as annually, monthly, or quarterly.
How To Use NPV Function in Google Sheets?
The NPV function assumes that cash flows occur at regular intervals, such as yearly or monthly, and discounts them to their present value using a specified rate. You can use NPV in two main ways:
- Enter NPV manually
- Use the function from the Google Sheets menu.
Enter NPV Manually
To calculate NPV in Google Sheets manually, follow these steps:
Step 1: Enter the required cash flow values that are at regular intervals (quarterly, annually) into a sheet. Enter the discount rate in a separate cell.

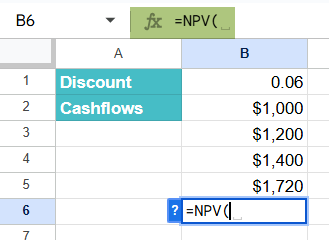
Step 2: Click on the cell where you want the NPV result to appear. Now, type =NPV( into the cell.
=NPV(
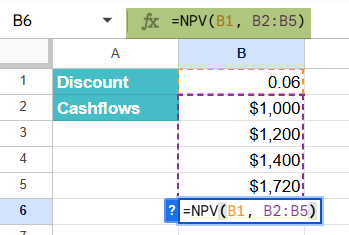
Step 3: Now enter the arguments, separated by commas, by referencing the appropriate cell.
=NPV(B1, A2:A5)
Where B1 contains the discount rate and A2:A5 contains the periodic cash flows.
Step 4: Press Enter. It will calculate and return the net present value of those cash flows.

The result can be positive or negative. A positive NPV suggests the investment is expected to be profitable, while a negative NPV may signal a possible loss.
Entering NPV Through the Menu Bar
- Go to the Insert tab in Google Sheets.
- Choose Function -> Financial.
- From the list, select NPV.
- Fill in the required arguments and press Enter.
Examples
Let us look at some interesting examples to study NPV in Google Sheets with some real-time examples.
Example #1
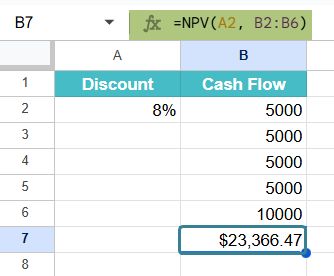
In this example, a person wants to invest in a small property. The property will generate annual rental income for 5 years. However, they expect to sell it at the end of year 5. All cash flows are expected at the end of each year. The person wishes to calculate whether the investment is profitable based on the expected rate of return of 8%.
Since the cash flows occur regularly (once per year), the NPV function is ideal for this situation.
Step 1: Enter the data as shown below.

Step 2: Click on the cell where you want the result to appear. Enter the following formula:
=NPV(A2, B2:B6)
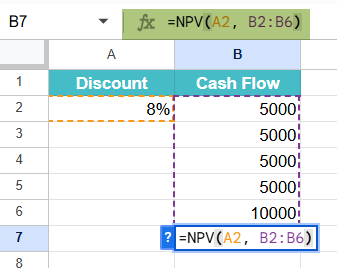
Step 3: Press Enter. This function calculates the present value of the future cash flows using an 8% discount rate.
The result will show the net present value of this investment. Here, the NPV is approximately $23,366. This means that, considering the required rate of return, the rental property is worth about $23,366 in today’s money.
If the initial purchase cost of the property is less than $23,366, then, it’s a good investment opportunity.
This example shows how the NPV function helps investors evaluate future cash flows from regular income sources like rent.
Example #2 – Calculate NPV Using Variable Discount Rates
A company is evaluating a 4-year project with the following expected cash inflows. However, due to market volatility, the expected rate of return changes each year. As the NPV function only accepts a single discount rate, we’ll calculate the average rate to represent these varying expectations in this NPV in Google Sheets example.
Step 1: Enter the data in a Google Sheet, as shown below.

Step 2: Let us find the average of the discount rates.
=AVERAGE(B2:B5)

This gives 9% as the average discount rate.
Step 2: Use the NPV Function in a new cell.
=NPV(B6, A2:A5)
It computes the NPV of the cash flows using the average discount rate.
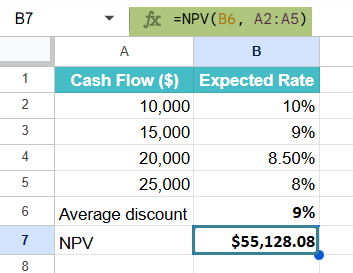
We get the calculated NPV as $55,128.08.
This result indicates that, based on the average of the discount rates, the project is financially viable and profitable, as the NPV is positive.
Example #3 – Use NPV to Compare Investment Options
Let’s explore how to compare two investment options using the NPV function in Google Sheets.
Suppose we wish to invest $40,000 and are considering two different projects. Both provide returns over a 4-year period, but with different cash flow patterns. The discount rate for both is 9%. Let us compare them to
Step 1: Enter the data in a sheet as shown below:

Step 2: Use the NPV function for each project.
=NPV(0.09, A2:A5) – 40000

For Project B, enter:
=NPV(0.09, B2:B5) – 40000

These formulas calculate the present value of future cash flows and subtract the initial investment to get the net gain or loss.
- Project A, NPV: $1,774,02
- Project B, NPV: -$8,729.32
Since Project A has a higher NPV and is positive, it is the better investment based on the given discount rate.
This approach lets you compare long-term investments.
Important Things to Note
- NPV is like PV, but NPV allows variable-value cash flows.
- Each cash flow argument should be positive if it represents income from the perspective of the owner of the investment or negative if it represents payments like loan repayment.
- Cashflows are considered in the order they are referenced.
- If the cash flows of an investment are irregularly spaced, use XNPV instead.
Frequently Asked Questions (FAQs)
The main difference between the NPV and XNPV functions lies in how they treat the timing of cash flows. The XNPV function allows you to specify the dates of the cash flows, while the NPV function does not. Therefore, the XNPV function is more flexible and can be used in a variety of applications than the NPV function.
1. The NPV function considers the cash flows in the order they are referenced. Hence, remember to keep them in the right order.
2. Always ensure that the time periods are consistent; they should be either in weeks, months, or years. Each cash flow should have the same amount of time from the next. If the cash flows are not consistent, use the XNPV function.
3. The discount rate must be based on the same time period as the cash flows. If the cash flow is annual, the discount rate must be annual.
4. A negative cash flow represents a payment from the user like a loan. Whereas a positive value represents the investor receiving income like a coupon.
5. The NPV formula can handle varying cash flow values, while PV is used for constant cash flows.
IN the content of investment, the investment is expected to generate profit, if it is positive. It will result in a loss if the investment is negative.
If the cash flows are irregular, that it, the time period between the cash flows varies, the results will be incorrect as NPV assumes regular intervals between cash flows. Use XNPV for irregular time periods.
Use this NPV in Google Sheets Template to follow along with the examples in this article.
Download Excel Template