What Is Percentage Difference In Excel?
The Percentage Difference function in Excel is a powerful tool that enables professionals to calculate the relative change between two values and express it as a percentage. It is commonly used in data analysis and financial modeling to assess growth or decline rates, investment returns, or other performance metrics. To compute the percentage difference, one needs to subtract the starting value from the ending value and divide this result by the starting value. Multiplying this figure by 100 provides the final result as a percentage.
This formula helps professionals understand trends and variations, aiding decision-making processes. With its ease of use and accuracy, Excel’s Percentage Difference formula has become an indispensable feature for professionals across various industries seeking to quantify changes in numerical data conveniently and effectively.
We can utilize the difference function to find the change in the percentage of columns A and B in Excel.
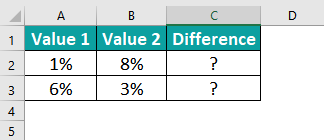
First, begin by entering the formula “=B2-A2” in cell C2. The resulting value in cell C2 will represent the change, expressed as a percentage, which in this case is 7%.
Next, to apply this formula to all the cells, drag the formula cell from C2 to C3. This will copy the formula to all the desired cells, analyzing the percentage change across the columns.
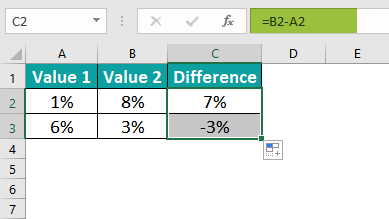
Likewise, we can find percentage difference in Excel.
Table of contents
Key Takeaways
- Percentage difference in Excel measures the variance between an old and a new value, expressed as a percentage. This is based on the assumption that the old value serves as the reference point.
- The subtraction of two percentages invariably yields a percentage as the final result.
- Before formatting a cell as a percentage, dividing the cell’s value by 100 is essential.
- Whether we input 0.20 or 20 in a cell formatted as a percentage, the outcome will be 20%.
- If a value less than one is inserted into a cell designated for percentage formatting, Excel will promptly multiply it by 100.
How To Calculate Percentage Difference In Excel? (With Steps)
- First, identify the two values we want to compare and subtract the smaller value from the larger one.
- Then, divide the result by the absolute value of the smaller number.
- Next, multiply the quotient by 100 to convert it into a percentage.
- Finally, format the cell containing the result as a percentage for better visibility.
Examples
Example #1 – Percentage Increase/Decrease In Excel Among The Columns
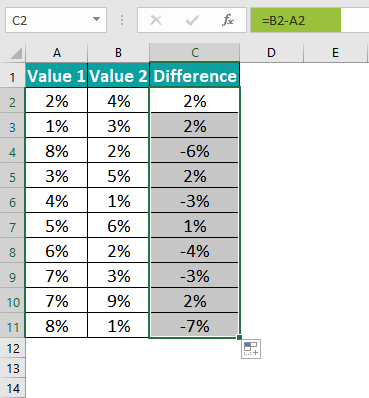
We can utilize the difference function to find the change in the percentage of columns A and B in Excel.
Step 1: If the resulting value is not formatted as a percentage, we can easily rectify this by formatting the respective cell accordingly. To do so, go to the Home tab and select the Number option, followed by Percentage. This ensures that the value is shown in the desired format.
Step 2: We can hide the decimal points in our percentage representation if we wish to delete them. By using the Format Cells excel feature, we can adjust the decimal count to zero instead of the default two. This removes the decimal points, giving a cleaner and more concise presentation of the percentages.

Step 3: Now, enter the formula in cell C2 as =B2-A2.

Step 4: The result in cell C2 is 2%.

Step 5: Next, drag the formula cell from C2 to C11 to copy the formula in all the cells.
Example #2 – Percentage Change Among The Rows
In this case, we will find the change in data when it is presented vertically.
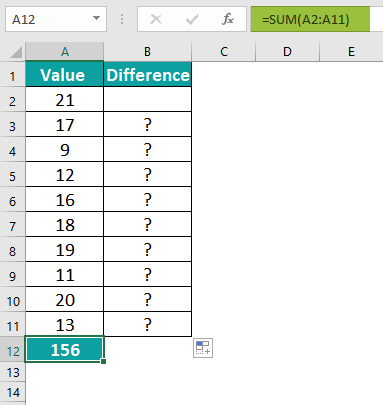
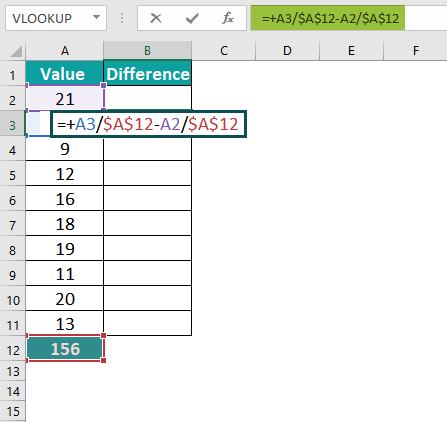
We need to insert the given function below the data to achieve this. This function will find the percentage for the last row value and then subtract the resulting value from the percentage of the next value.
Step 1: First, to find the difference, we will use the following formula:
Value of prior row/Total value – value of next row/total value.
The formula is =+A3/$A$12-A2/$A$12.
Step 2: The result in cell B3 is -3%.
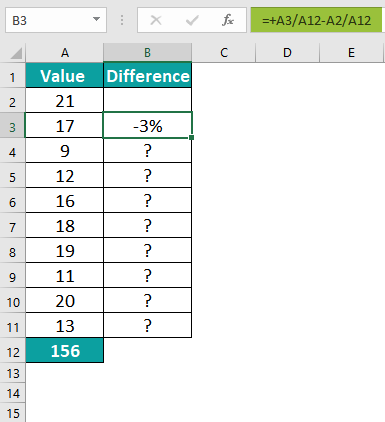
Step 3: Now, we can drag the plus sign to obtain the differences for all the rows.

Example #3 – Output Is Reduced By A Certain Percentage
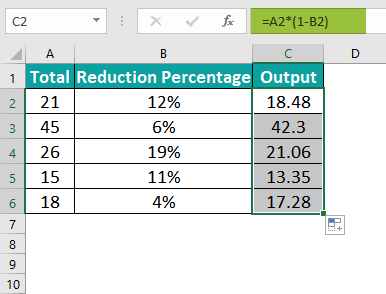
We can find the difference between two percentages and determine the resulting amount if a specific percentage decrease occurs.
Step 1: To begin with, to observe the decrease in output by a particular percentage, please refer to the provided data.
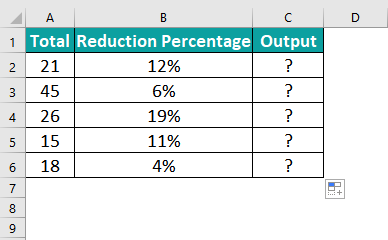
Step 2: Now, we have devised a formula that reduces the amount by the percentage. The formula is,
Amount * (1 – reduction required)
The formula is =A2*(1-B2)

Step 3: Now, the reduction in output for all values, based on a certain percentage, is shown below:
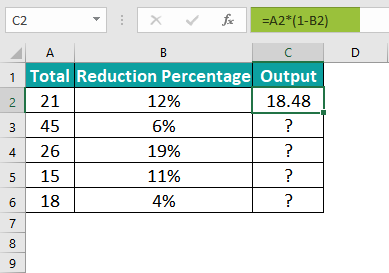
Step 4: Now, we can obtain the differences for all the rows by dragging the plus sign.
Example #4 – Percentage Increase/ Decrease Between Two Numbers
We can display the change between two amounts as a percentage in Excel.
Step 1: First, we can utilize the provided data to determine the percentage difference between the two numbers.

Step 2: Now, we need to develop a function that finds the change and subsequently finds the percentage. The formula is (New Amount – Old Amount) / Old Amount.
The formula is =(B2-A2)/A2.
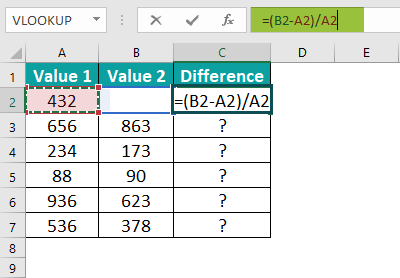
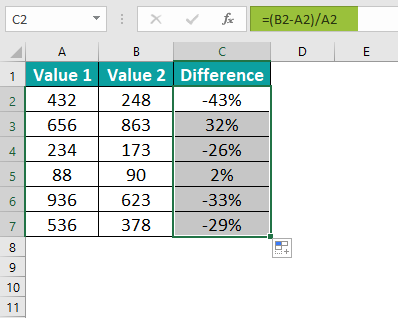
Step 3: The resulting percentage difference between the two numbers will be:

Step 4: Next, we can find the differences for all rows by simply dragging the plus sign.
Important Things To Note
- Furthermore, comparing two values using percentage differences can provide valuable insights into the extent to which an entity has separated from its original value.
- A positive percentage difference signifies an increase or growth, while a negative percentage difference shows a decrease or decline in value.
- To find the percentage difference between two values, subtract the old value from the new value, divide the result by the old value, and then multiply the outcome by 100.

Frequently Asked Questions (FAQs)
• This method is valuable for monitoring stock price fluctuations and market index changes.
• It compares currency values and aids in understanding financial statements within balance sheets.
• Businesses can determine the extent of profit or loss from their sales.
We can use a simple formula involving subtraction and division to find the percentage difference in Excel. 
First, subtract the original value from the new value to determine the difference. For example, if A2 contains the original value and B2 contains the new value, enter =B1-A1 in a different cell. Next, divide this difference by the original value and multiply it by 100 to obtain the percentage difference. This can be done by entering “=((B2-A2)/A2)*100” in another cell. Now, the result will be shown as a decimal number representing the percentage change.
If we want to format it as a percentage with two decimal places, select that cell and click Percentage under Excel’s Home tab’s Number Format options. This formula is useful when comparing values over time or analyzing fluctuations in data sets, providing a clear measure of how much one value has changed relative to another.
Likewise, we can find percentage difference in Excel.
• Firstly, the formula finds the percentage change between two numbers or data points, which may not be apt for comparing percentages of small values.
• Additionally, the formula assumes that both the compared numbers are valid and accurate, which might not always be the case – any errors or inconsistencies in the data will affect the reliability of the results.
Download Template
This article must help us understand the Percentage Difference in Excel formulas and examples. We can download the template here to use it instantly.
Recommended Articles
Guide to Percentage Difference In Excel. Here we learn how to calculate percentage difference in excel with step by step examples and template. You can learn more from the following articles –

Leave a Reply