What is Percentile Rank in Excel?
In statistics, we define percentile rank formula as the numerical value of a particular percentile. It is commonly used to assess how a specific score compares with other scores in a set. For example, suppose a value has 30% of the data set below it; its percentile rank is 30.
Below is a list of the marks of some students. To find the marks at the 40th percentile, we must use the formulas as shown in the comments below. As a result, we get a value of 67.4 for the 40th percentile.
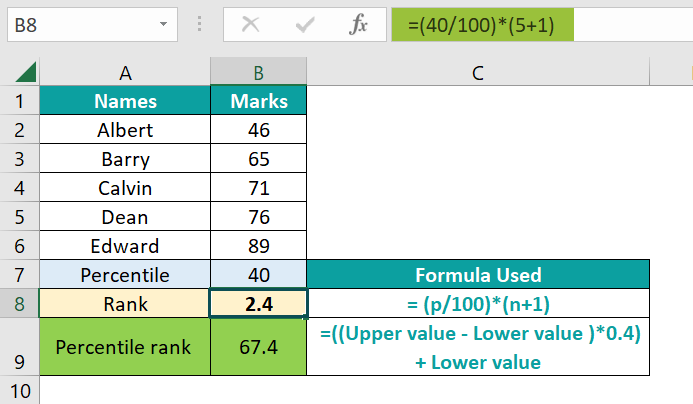
Table of contents
Key Takeaways
- The percentile rank formula gives the numerical percentile of values in any given list.
- We can use the mathematical formula R = (P/100)*(n + 1) or the PERCENTILE.EXC function in Excel to determine the percentile rank.
- The value of k in the PERCENTILE formula can be entered as a decimal or a percentage. If entered as less than zero or greater than one, it gives an error.
- We can use the function mainly to determine, for example, how many students scored above a particular percentile in a test.
Percentile Rank Formula() Excel
The percentile rank formula is usually calculated as follows:
| R = (p/100)(n + 1) |
Here,
- p represents the percentile
- n represents the number of items in the data set.
The Excel formula equivalent for the above function is,

Here,
- the array represents the set of data values
- k represents the kth percentile
How to Use Percentile Rank Formula in Excel?
We can calculate the percentile rank values in Excel using the mathematical formula or the PERCENTILE Excel function.
It can be done by:
- Manually typing the above two formulas in an Excel cell
- Selecting the PERCENTILE formula from the Excel ribbon
Manual Insertion of Percentile Rank Formula
Let us look at a basic example where we must calculate a data set’s percentile ranks using the mathematical formula and the function.
The students in a class have scored the following marks.The scores are 57, 46, 69, 79, 71, 95, 81, 86, 62, and 69. Find percentile rank formula for the 75th percentile.
The steps and formula to calculate Percentile Rank is given below –
- Enter the scores in the excel worksheet in ascending order to apply the formula.

- Now, use the formula R = (p/100)(n + 1) to find the rank. We have entered the percentile and the number of students in cells D1 and D2, respectively. Enter =(D1/100)*(D2+1) in cell D5.

- When you press Enter, you get the rank value of 8.25. To find the percentile rank, do the following steps.
• Since 8.25 falls between the 8th and the 9th values, 81 and 86, you should remove the ‘8’ value and multiply their difference with 0.25 (8.25 – 8).
(Upper value – lower value) * 0.25
• Add this value to the lower value 81 to get the exact rank at 8.25.
• Applying this formula, we get (86 – 81)*0.25 + 81 = 82.25.
• It is the value that corresponds to the 75th percentile.
- We can also use the PERCENTILE.EXC formula and enter it manually in cell D8. Enter the following formula =PERCENTILE.EXC(A2:A11, 75%). You get the same result as above.

Entering the Percentile Rank Formula through the Excel Ribbon
To find the Percentile rank, place the cursor where you want to see the result and enter the percentile rank formula PERCENTILE.EXC() through the Excel ribbon.
- Go to the Formulas tab, and in the Function Library, click on More Functions.
- Under it, click on Statistical and select PERCENTILE.EXC function.

- In the pop-up dialog box, enter the value of the array and the percentile for calculation.

Thus, as observed, the percentile rank formula is simple to use in Excel.
The PERCENTILE.EXC() and PERCENTILE.INC() Function
From Excel 2010, the PERCENTILE function has been replaced by PERCENTILE.EXC and PERCENTILE.INC function to determine the kth percentile of values in a range.
Here, PERCENTILE.INC works for any value of k between 0 and 1 and includes these values.
PERCENTILE.EXC excludes the values of 0 or 1 for k and includes only those numbers between them. It is preferable to use this function for large datasets where k should lie between 1/n and 1-1/n, where n is the number of elements in the array.
Examples
The percentile rank can be calculated simply in many scenarios involving statistics, such as calculating the percentile ranks of students’ marks or for a population.
Example #1
Let us take an example to use the percentile rank formula for grouped data. Here, we must find the 50th percentile of the temperature recorded in a city over 12 months. Here, we have the average maximum temperatures recorded in Tokyo over a period of 12 months in Fahrenheit – 49, 51, 57, 66, 74, 79, 86, 88, 82, 72, 63, and 54. Now, calculate the 50th percentile temperature.
- Step 1: First, let us arrange the temperatures in ascending order and rank them for easy calculation.

- Step 2: Let us apply the formula to find the 50th percentile. Enter the following formula in cell E2: =(50/100)*(A13+1) and press Enter.
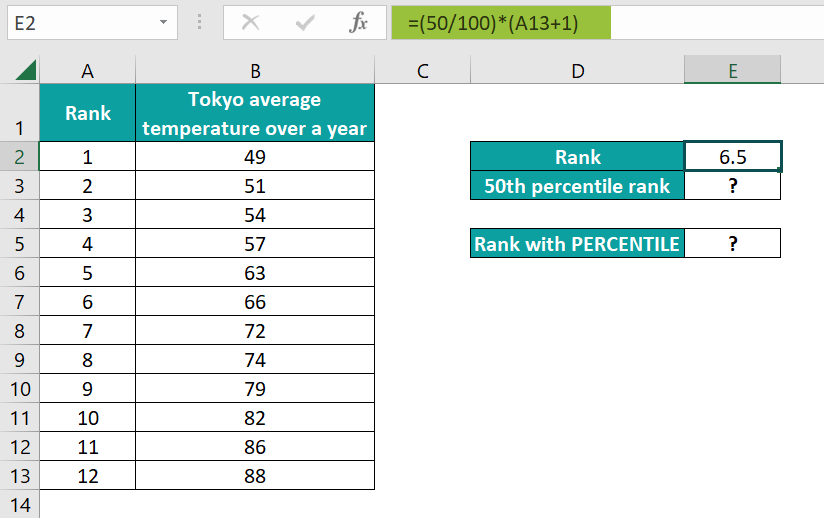
- Step 3: The value 6.5 shows that the average temperature lies between the 6th and 7th values, that is, between 66 degrees F and 72 degrees F.
To calculate the exact 50th percentile rank, in the number 6.5, we take 0.5 or the 50% value between 66 and 72 and add it to the lower value of 66.
Enter the formula =(72-66)*0.5+66 in cell E3.

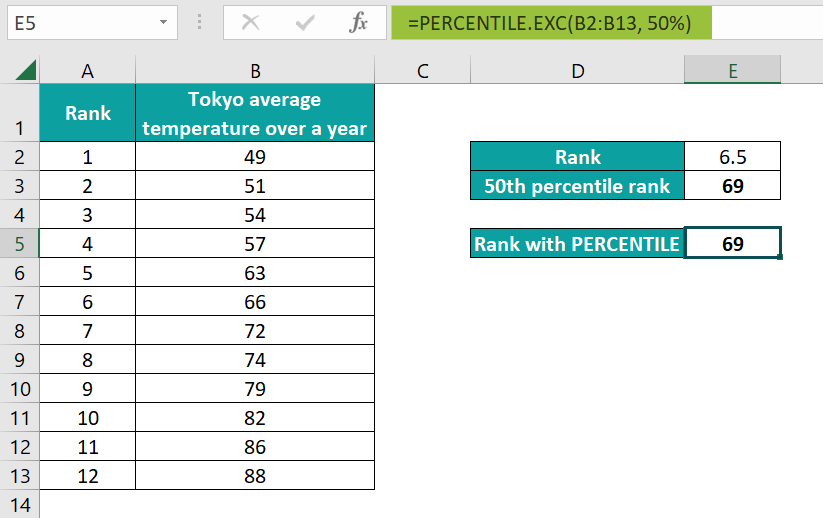
We get a value of 69. It means that 50% of the temperature was below 69 degrees Fahrenheit in Tokyo.
- Step 4: We can verify this using the PERCENTILE.EXC() formula. Type the formula =PERCENTILE.EXC(B2:B13, 50%) in cell E7.Press Enter and check the value.
Example #2
Let us take the example of a city’s population of 10 neighborhoods. Here, first, we must calculate the 45th percentile and the third quartile values.
Given below is a table containing the population in thousands. To make calculations more accessible, let us rank each neighborhood and arrange them in the ascending order of the number of people, as seen below.
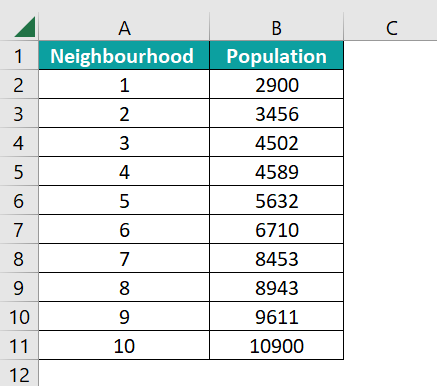
- Step 1: Now, we must find the 45th percentile rank and the third quartile, which means the 75th percentile.
- Enter these values in cells E2 and E3.
- Now, enter the formula to find the value for the 45th percentile as =(E2/100)*(A11+1) in cell E6.
- We get a value of 4.95. It means that the 45th percentile rank lies between the 4th and 5th values, that is, between the populations 4589 and 5632.

- Step 2: Now, you must calculate the value for the 45th percentile as follows.
In 4.95, the 45th percentile is 0.95%, away from the fourth value of 4589. So, to get this value, type the formula =(5632-4589)*0.95 + 4589 in cell E7.

- Step 3: Thus, we get the value 5579.85, which can be rounded off to 5580. It means that 45% of the population is below 5580.
- Step 4: Now, to find the 75th percentile value, change the formula and type =(E3/100)*(A11+1) in cell E9. You get 8.25.

- Step 5: Since the 75th percentile lies between the 8th and 9th values of 8943 and 9611, we calculate the percentage rank as =(9611-8943)*0.25 + 8943 in cell E10.
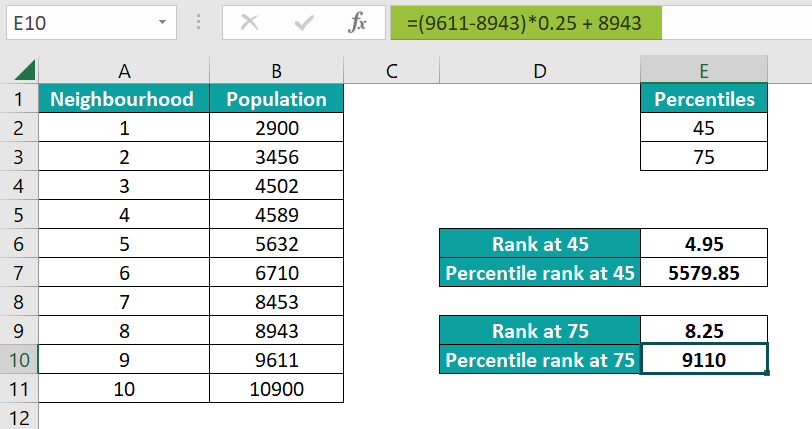
Thus, the 75th percentile rank is 9110, meaning 75% of the population is below 9110.
Example #3
Till now, we have calculated the percentile rank using the mathematical formula. Now, given students’ test scores, you must calculate the percentile of their scores. How can this be done? For this, you can use a combination of the RANK.EQ and COUNT function in Excel.
Let us take an example where the scores of students are given in a table. You are required to calculate under what percentile their score falls.

To find the percentile under which each score falls, we can use the RANK.EQ function.
Arguments –
- Number: returns the rank of the number mentioned
- Ref: the array/data set whose numbers are to be ranked
- Order:
- 0 – ranks numbers as if the array was in descending order
- Non-zero – ranks numbers as if it sorted the array in ascending order
COUNT: Gives the number of entries in an array.
- Step 1: Now, enter the following formula in cell C1.
=RANK.EQ(B1,$B$1:$B$9,1)/COUNT($B$1:$B$9)
- Here, B1 is the mark to be ranked, and the range of cells is from B1 to B9, marked as absolute because we will drag the formula.
- The one(1) indicates that the lowest number will get the lowest percentile.
- Similarly, we are counting the number of items in the data range.

- Step 2: Now, press Enter. You get 13% as the rank percentile of Albert. Drag the Autofill handle up to C9. You get the percentile values for all the students’ marks.

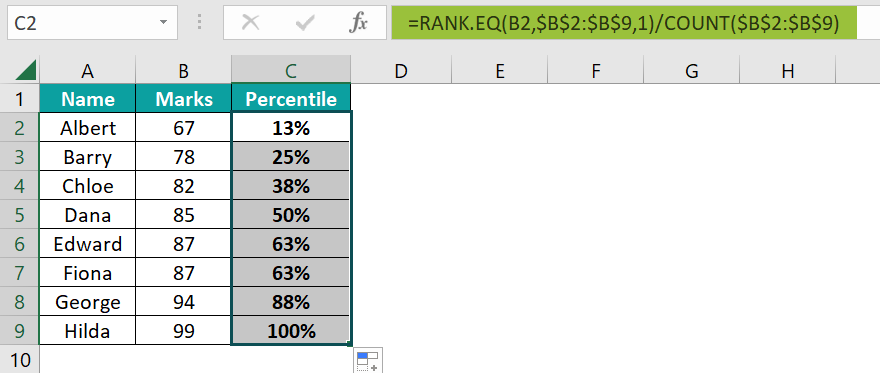
You will observe that the student with the highest marks is in the 100th percentile, meaning 100% of the students have scored below Hilda.
Thus, you can calculate the percentile rank values and the percentile using appropriate formulas, as seen in the above examples.
Important Things to Note
- We can use the mathematical or PERCENTILE.EXC formula to calculate the percentile range of large datasets.
- When you use the PERCENTILE.EXC formula, you get an #NUM! Error if the second argument, the k value is less than 0 or greater than 1.
- If the k-value is non-numeric, you get an #VALUE! Error.
- The percentile rank is mainly used in statistics, especially to report scores of students based on percentile in important exams like SAT.
- The percentile rank helps find the relative picture; for instance, if you have scored 82/100 on a major test, you need to know how well you have performed. If 82/100 falls within the 92nd percentile, you have performed better than 92% of the students, which provides you with an idea of where you stand.

Frequently Asked Questions (FAQs)
• Percentile indicates that a certain percentage of scores fall below that percentile. For example, if n is 20%, we are looking for the lowest score that falls immediately above 20%.
• We can assume 20% to be the percentile rank in this case.
However, statistics have different definitions for Percentile and Percentile rank. The above are the simplest explanations.
To find the percentile rank, you can use the PERCENTILE.EXC formula besides the mathematical formula. If the value of the second argument, k, used in the function, is less than 0 or greater than 1, you get an #NUM! Error. You also get an #VALUE! Error if the value is non-numeric.
In the PERCENTILE.EXC function, the second argument k lies between 0 to 1, excluding these values. In the PERCENTILE.INC function, k includes the highest and lowest values of 0 and 1.
The percentile rank formula determines the relative value of a score. Therefore, it can help grade students’ marks as a percentile to evaluate performance.
Download Template
This article must help understand the Percentile Rank Formula and examples. You can download the template here to use it instantly.
Recommended Articles
Guide to Percentile Rank Formula. Here we learn to calculate it using PERCENTILE.EXC and other formulas, examples & downloadable excel template. You can learn more from the following articles –


Leave a Reply