
What is Poisson Distribution in Excel?
The Poisson Distribution in Excel predicts the number of events that occur over a given interval of time or space. E.g., the number of ships crossing the Panama Canal in a day. It is one of the most used functions in Excel, classified under Statistical functions. The POISSON.DIST function was first introduced in Excel in 2010.
For example, an ice cream store receives an average of 150 customers daily. We must find the probability of the store receiving 170 customers a day. In this example, the mean is 150, and the expected number of events is 170. We can use the POISSON.DIST function to calculate the cumulative probability distribution. Apply the formula =POISSON.DIST(170, 150, TRUE) in cell C4.
Use this Poisson Distribution in Excel Template to follow along with the examples in this article.
Download Excel Template
Key Takeaways
- The POISSON.DIST function in Excel calculates the probability of the number of times an event occurs over a given interval.
- By specifying the third argument as TRUE, we get the cumulative probability of the events happening between zero and x. For FALSE, we get the probability of x number of events happening.
- Companies can use it to improve their operational efficiency by predicting the variation from a known average occurrence rate, in specific time frames.
Poisson Distribution() Excel Formula
The syntax of the Poisson Distribution function is as follows:
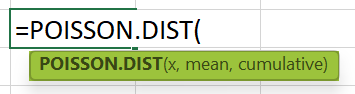
Arguments
- x (mandatory) – Indicates the number of events whose probability of occurrence will be calculated. It should be greater than or equal to zero.
- Mean (mandatory): This is the number of expected events. Again, it should be greater than or equal to zero.
- Cumulative (mandatory): It specifies the type of distribution that will be calculated. It can be either:
- TRUE – Represents cumulative. It returns the cumulative probability of many events happening between zero and x.
- FALSE – Represents the exact number. It returns the probability of exactly x number of events happening.
Uses of Poisson Distribution
The Poisson Distribution can be used to improve companies’ operational efficiencies and overall performance. Using Poisson distribution in Excel, one can find the probability of a gambler’s winning streak to the number of meteors striking the Earth over a specified period.
You can use the Poisson distribution under the following circumstances.
- When the events happen randomly, that is, the probability of the occurrence of one event doesn’t affect the other.
- When you know the mean number of events happening within a given interval, the probability of an event occurring is the same for any given time interval.
How to Use Poisson Distribution Excel Function?
We can use the Poisson Distribution in Excel in the following ways.
- Manually Entering the formula in a cell.
- Entering the POISSON.DIST formula through the Excel cell.
Manually Entering POISSON.DIST in an Excel Cell
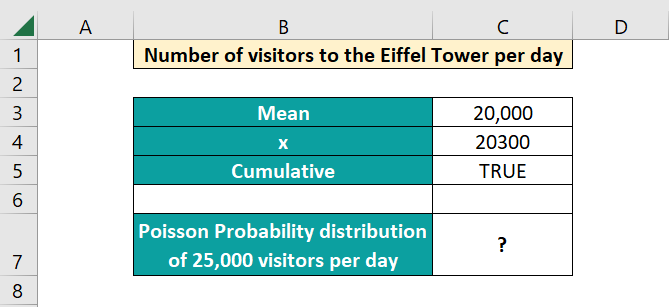
Let us take an example. Statistics say that the number of visitors per day to the Eiffel Tower in Paris during the tourist season is 20,000.
Now, let us calculate the Poisson probability of the number of visitors being 300 more than the usual average per day (20,300).
- Enter the details such as mean and x value in the Excel sheet.

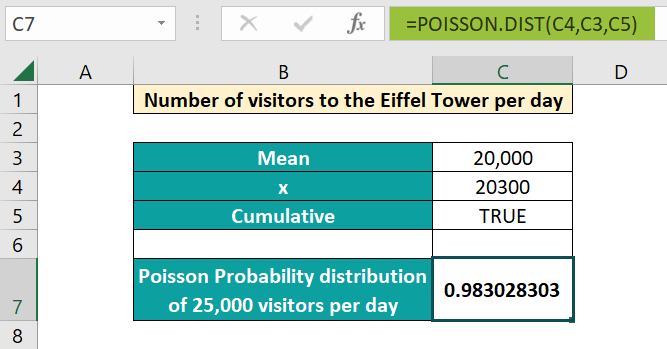
- Enter the Poisson formula =POISSON.DIST(C4,C3,C5) in cell C7. We use TRUE as the third argument since we want to know the result for exactly 20,300 visitors. Press Enter.

- Check the value in cell C7, 0.9830283. Thus, we can easily calculate the Poisson distribution in Excel by entering the formula manually.
Poisson Distribution in Excel through Excel Ribbon
Besides manually entering the formula, you can also enter the POISSON.DIST in Excel shortcut through the Excel ribbon.
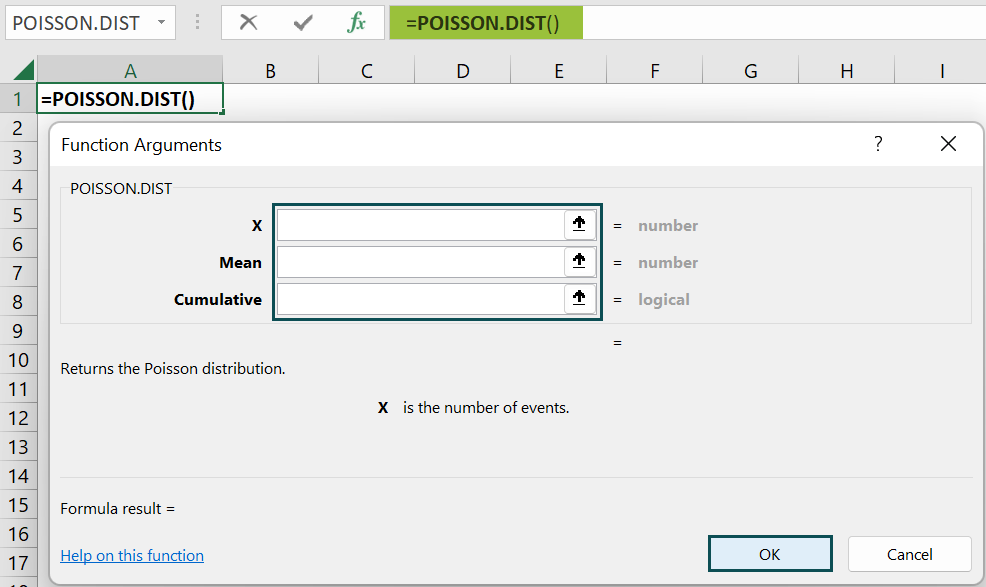
- Step 1: Place the cursor where you want the formula to be entered. Then, go to the Formulas tab in the Excel ribbon and click on the drop-down arrow in More Functions. Select the Statistical option and from the list, choose POISSON.DIST.

- Step 2: You get the pop-up window. Enter the values of x, mean and cumulative to get the Poisson distribution value.
Thus, the function for Poisson Distribution is simple and saves you a lot of calculations, usually done with the formula.
Examples
The POISSON.DIST function has a wide range of uses. Below, let us look at some simple and advanced Poisson distribution in Excel examples of how we can use this function to find the Poisson Distribution in Excel for different scenarios.
Example #1
Let us consider a simple example. An average of 24 children visit an aquarium in an hour. Let us find the Poisson probability distribution using the Poisson function for different values of x, that is, various numbers of visitors.
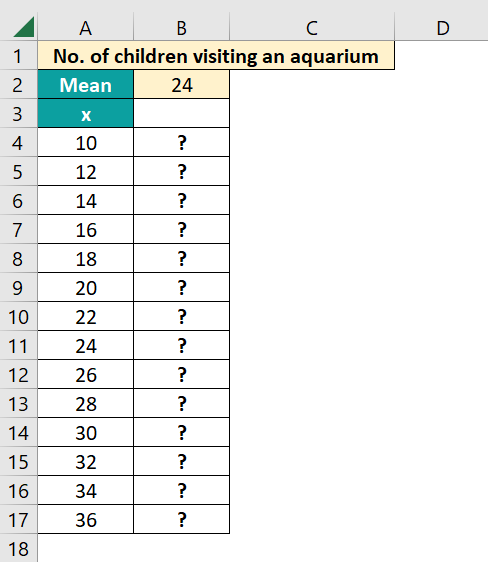
- Step 1: We will look for different values of x with a mean of 24. Since we find the probability for exact values, we use 0 as the third argument. Enter the formula =POISSON.DIST(A4, $B$2,0) in cell B4.
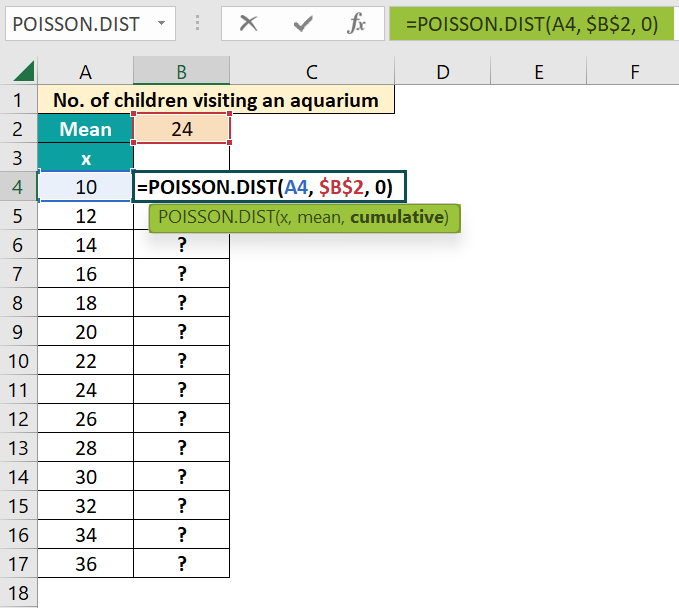
- Step 2: Press Enter. We get the probability value 0.00066 for x=10. Drag the Autofill handle up to B17 to get the probability for different values of x. Here, we have locked the second argument since the mean is constant.

- Step 3: We can represent this information on a chart. Select the values from B4 to B17. Go to the Insert tab and choose Insert Column or Bar Chart in the Charts group.

- Step 4: Now, choose a chart of your choice and get the Poisson distribution representation.
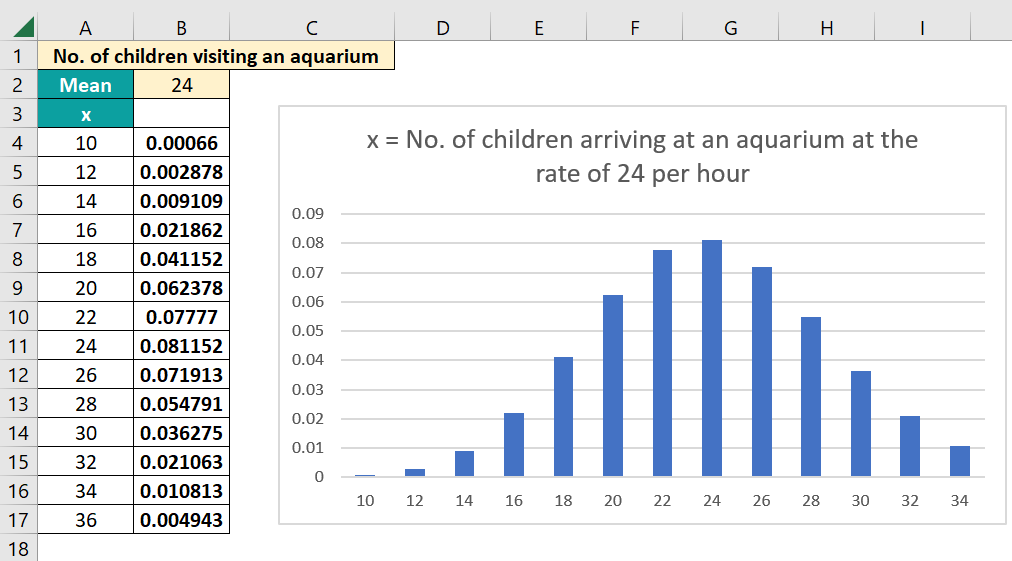
Thus, the curve shows the Poisson distribution for different values of x.
Example #2
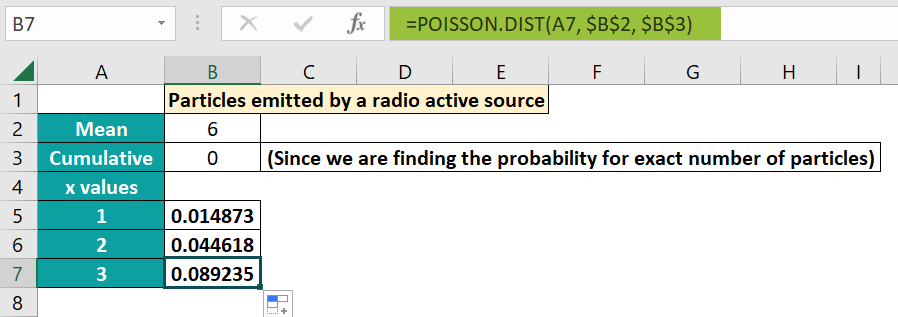
Let us consider the number of particles emitted by a radioactive source. The mean number of particles emitted is 6 per second. Now, we can calculate the probability that 1, 2, and 3 particles are emitted per second.
- Step 1: Let us enter the details of x and mean in Excel and calculate the probability.

- Step 2: Use the formula =POISSON.DIST(A5, $B$2, $B$3) in cell B5.
- Here, we enter $B$2 and $B$3 to make them absolute references so that their values do not change when the function is copied down.
- A5 represents the x value.
- We give 0 for cumulative since we want to calculate the probability that exactly one particle is emitted per second.

- Step 3: Press Enter. You get the value 0.017351, which indicates the probability that one particle is emitted per second. Copy the formula to cells B6 and B7 to show the probability of 2 and 3 particles emitted per second, respectively.
Example #3
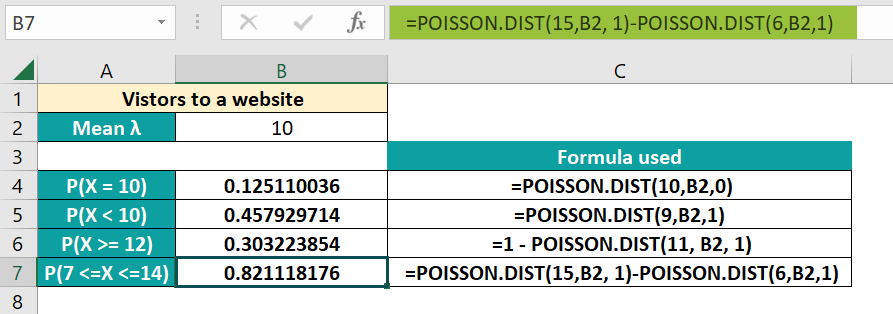
In this example, we can simulate Poisson distribution in Excel and find the cumulative probability of an event happening. Let us take an example of a website run by a businessman. He gets an average of 10 visitors to his site per hour. Let us assume a Poisson model and find the expected probabilities of the following occurrences per hour.
- No. of visitors is precisely 10 (X = 10)
- No. of visitors is less than 10 (X < 10)
- No. of visitors is greater than or equal to 12 (X >= 12)
- No. of visitors is between 7 and 14 (7 <=X <=14)

- Step 1: Let us take the first condition. X= 10. We must find the probability that exactly ten visitors per hour visit the site. For this, type the formula =POISSON.DIST(10,B2,0) in cell B4.
- For the third argument, we use 0 because we are finding the probability for the exact value of 10.
- Press Enter. You get the probability value.

- Step 2: Next, we must find the probability when X < 10, that is, there are less than ten visitors per hour to the website. Enter the formula =POISSON.DIST(9,B2,1) in cell B5.
- We use nine as the first argument since we must find the probability of visitors less than 10.
- For the third argument, we use one because we are calculating the probability for all values less than 10.
- Press Enter. You get the probability value.

- Step 3: We must find the probability when X >= 12; that is, there are more than 12 visitors per hour to the website. Enter the formula =1 – POISSON.DIST(11, B2, 1) in cell B6.
- We use 11 as the first argument since we are finding the probability for all values from 12.
- For the third argument, we use one since it is for a range.
- We subtract the probability of having 11 visitors or below from 1 to get the probability of the site having 12 visitors or more in an hour.
- Press Enter.

- Step 4: We must find the probability when x is between 7 and 14; that is, there are between 7 to 14 visitors per hour to the website. Enter the formula =POISSON.DIST(15,B2, 1)-POISSON.DIST(6,B2,1) in cell B7.
- We subtract the probability of having 15 visitors or greater per hour from having 6 or fewer visitors to get the probability between 7 and 14. Press Enter.
Thus, we use the formula to find the probability of different occurrences in different fields, from statistics to science.
Important Things to Remember
- For Poisson distribution, the probability of an event occurring should be the same for any time interval.
- You get an #NUM error if the value of x or the mean is below zero. An #VALUE! Error occurs for non-numeric arguments.
- If the x value is a decimal, it is truncated to an integer.
- Scenarios, where the rate is not constant, cannot follow a Poisson distribution. e.g., the number of earthquakes per year.
Frequently Asked Questions (FAQs)
The Poisson distribution in Excel can be found using the POISSON.DIST() function. We calculate Poisson distribution in Excel to find the probability of an event occurring a certain number of times in any given time interval. Before Excel 2010, the POISSON function was used.
The Lambda value signifies the average number of occurrences for a given time interval. It can be calculated in Excel using the SUMPRODUCT function applied to the different events and the count of the occurrences and divided by the total count.
Lambda λ = SUMPRODUCT(range of the occurrences, range of counts)/total count
If the mean or x argument is less than zero in the Poisson distribution in Excel, you get an #NUM error. Also, you get the #VALUE error if any argument is non-numeric in the function.
Use this Poisson Distribution in Excel Template to follow along with the examples in this article.
Download Excel Template