
What is Average Function in Power BI?
The AVERAGE function in Power BI is a statistical function that calculates the average or arithmetic mean of a set of numeric values in a column of a table or a selected set of data. It can be used to analyze data and gain insights into trends and patterns.
Key Takeaways
- The AVERAGE function in Power BI is useful for calculating the average values in a column or a selected data set.
- It can be used in various contexts and is particularly helpful for gaining insights into trends and patterns in data.
What Does AVERAGE Function Do in Power BI?
The AVERAGE function in Power BI calculates the arithmetic mean of a set by taking into account all the values in the column or data set. It excludes any blank or null values and returns a single value representing the average values in the column.
For example, if there are 50 employees in a department with different salary ranges, then, using the AVERAGE function, we can calculate the average salary for that department. The AVERAGE function takes only one argument and is defined as below:

You can perform various operations, such as calculating Power BI average by group, Power BI average per day, Power BI average per category, and Power BI average by month using the AVERAGE function. In the subsequent sections, we will see how you can perform these calculations with the help of examples.
Examples of AVERAGE Function in Power BI
Let us look at some examples where we can apply the Average Function in Power BI.
Example #1
In this example, we will go through the step-by-step calculation of Average Sales by Product using some Financials data.
Step 1: Create a new measure of Average Sales by Product on the Financials table either table by choosing the New Measure when you right-click on the Financials table or the New Measure option in the Modeling tab of the Power BI desktop.


Step 2: Define the measure and save the expression.

It will create a new measure of Average Sales by Product.

Step 3: Select this measure and drag it to Canvas to create a report in Power BI

Alternatively, you can calculate the average sales by choosing the Average option for the Sales field. Again, it doesn’t require any new measure to be created.

It will also provide the same result as the measure.

Example #2
In this example, we will calculate the Average Revenue per category using Financials data. To calculate, follow the steps highlighted below:
Step 1: Import the dataset and create a new column Revenue on the dataset using the New Column option Modeling tab in your Power BI Desktop.


Step 2: Create a measure using the Quick Measure option available in the Calculation ribbon.

Alternatively, you can also select the New quick measure option when you right-click on the imported table

Step 3: Choose the Average per category option from the dropdown in the Calculations tab in the Quick measure pane.

Step 4: Drag the column for which you want to calculate the average value in the Base value and the category in which you want the average in the Category column.

Click on Add.

It will create a new measure in the data table.

You can also see the Power BI DAX expression for this newly created measure.

Step 5: Now select this measure to canvas for creating a report in Power BI.

Example #3
Here we demonstrate the Power BI conditional average calculated using the Power BI AVERAGE function and the CALCULATE and FILTER functions. In this example, we will calculate the cv l509rAverage Revenue and Sales for specific products using the steps highlighted below:
Step 1: Select the table, right-click on it, and then choose the New Measure option.

Step 2: Define the measure by specifying the column to average and filters on product fields. Click on the Save icon. This will create a new measure of the Average Revenue by Products.

Here the Filter function first filters out the dataset other than Amarilla, Montana, and VTT products. Then, the AVERAGE function calculates the average value of the Revenue column on the filtered dataset. You can specify multiple filter conditions for Average calculation.
Step – 3: Now drag the newly created measure to Canvas to create a Power BI report.

As you can see, the average revenues for Amarilla, Montana, and VTT are calculated, whereas this is blank for the rest of the products.
Important Things to Note
- The Power BI AVERAGE function ignores text values, logical values, or empty cells but includes cells with 0 values in the calculation.
- It is important to note that AVERAGE works differently with cells with 0 and blank values. A cell with a 0 value is included for AVERAGE calculation, whereas cells with empty values are not counted.
- If you are using DirectQuery mode for defining calculated columns or row-level security (RLS), then this function is not supported.
- The function can be used with a single column of data or with multiple columns of data, depending on the specific analysis required.
- The column’s data type used in the function must be compatible with the function. If not, it may return errors or unexpected results.
- When using the AVERAGE function in Power BI, it is crucial to consider the context in which it is being used, as this can affect the analysis results.
Frequently Asked Questions (FAQs)
Some of the main differences between AVERAGE and AVERAGEX in Power BI are highlighted below: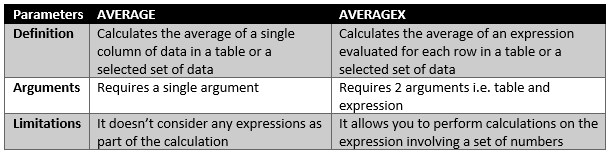
You can use the AVERAGE function either by creating a new measure or applying the Average for the column in the Columns section for the average count.
For example: Here, we have calculated the average cost and average revenue per product.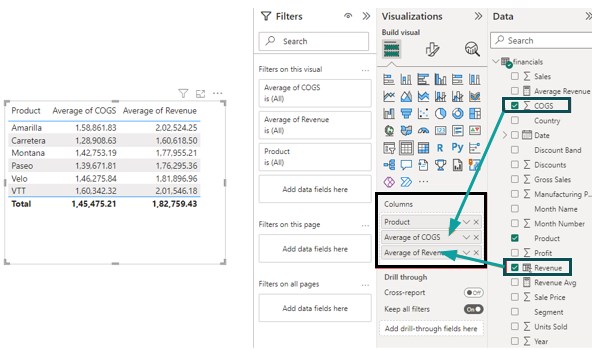
Additionally, you can also use Filter Context to calculate the average count on top of a filtered dataset.
To calculate the Average Cost of Goods Sold (COGS) and Average Revenue for specific products (Velo, VTT, and Paseo), create a new measure, “Avg COGS,” and apply it to CALCULATE function as shown below.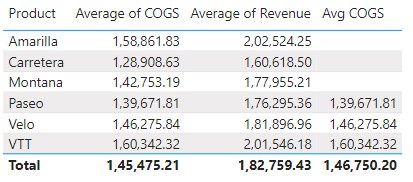
![]()
This will filter out the specific products and then calculate the average COGS.
There are multiple ways you can calculate the average of multiple columns.
1. Using the AVERAGEX function as a measure![]()
Here in the below example, we have calculated “Average Revenue per Product” using the AVERAGEX function by first calculating revenue per product and then averaging them out.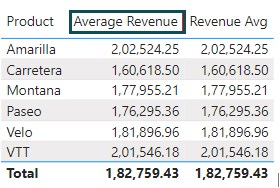
Another way is by creating calculated columns and using the SUM and COUNTROWS function.![]()
The Average function in Power BI may not work properly if there are issues with the data being used. Some possible reasons why the function may not work include:
• There are blank or null values in the data that are not being handled correctly by the function.
• The data type of the column used in the function is incompatible with the function.
• The column being used in the function contains text or non-numeric data.
Recommended Articles
Continue with these related resources when you want the next practical step in this topic.
- Power BI Dax
- Measures in Power BI
- Power BI Calculate
- Row Context and Filter Context in DAX
- Power BI Calculated Table
Explore the full Power BI Data Modeling and DAX guide or browse Power BI Resources.