What is Drill Through in Power BI?
Power BI Drillthrough is a feature in Power BI that allows users to navigate from a summary view of data to a more detailed view, focusing on specific data points. When you select a data point in a source report page or visual, you drill through to the target page to get granular details filtered to that context. Power BI Drillthrough filter can be set up in reports in both Power BI Desktop as well as Power BI Service. You can access the Drillthrough filter by navigating to the Visualizations pane, as shown below:
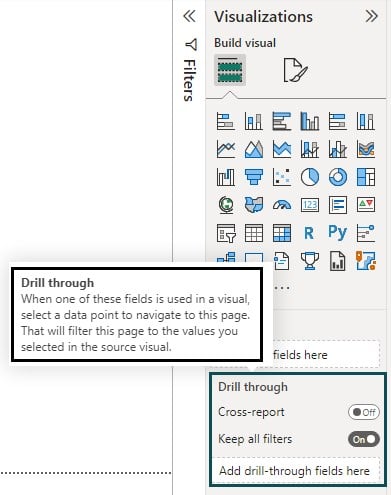
In the subsequent section, we will see how you can use a Power BI drillthrough filter.
Table of contents
Key Takeaways
- Power BI Drillthrough allows users to navigate from summarized data to detailed information.
- Drillthrough filters enable users to define the fields and filters for the drill-through pages.
- You can focus on a specific entity such as a manufacturer, through a destination page in your report.
- By following the steps mentioned, you can effectively use the Drillthrough feature to provide a more interactive and exploratory experience for your users.
📊 Unlock Advanced DAX Skills in Power BI!
Take your Power BI skills to the next level with our Advanced DAX in Power BI Training Course. Dive deep into advanced DAX functions, complex calculations, and optimization techniques to enhance your data analysis and reporting capabilities.
How to Use Drillthrough Filter in Power BI?
To use the Drillthrough filter in Power BI, follow these steps:
Step 1: Set up a Power BI Drillthrough target report Page:
The Drillthrough target report page represents the target report page that has the visuals for which you want to provide the drill-through.
- Open your Power BI report in Power BI Desktop.
- Create a new page or select an existing page where you want to provide a drill-through target report page
- Design the page with visuals and information that provide more detailed insights for specific data points.
Step 2: Define Drill-through Fields for Drill through Filters:
- Identify the fields in your data model that you want to enable drill-through.
- On the drill-through target report page, choose the field you want to enable drill-through and drag it into the Add drill-through fields here in the Drill through section in the Build visual section of the Visualizations pane.

Power BI automatically adds a back button icon to the report page when you add a field to the Power BI drillthrough filter.
The Power BI drillthrough button or the back button helps in the drillthrough to another page providing granular-level information for data analysis.
You can also create a customized image for this drillthrough button in Power BI Desktop.

Step 3: Pass all applied filters to the Drillthrough target page:
- After selecting the drill-through field, you can set up Drill through to pass all the applied filters to the Drill-through target page by navigating to the Drill through section of the Visualization pane
- In the Drill through section, set Keep all filters to On
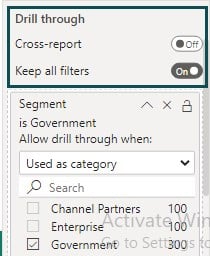
Step 4: Adding a measure to Drill through:
- Drag the field to be added to the drill-through filter in the Drill-through card on the Drill through target page.
- Choose a measure or summarised field to the drill-through area from the drop-down.
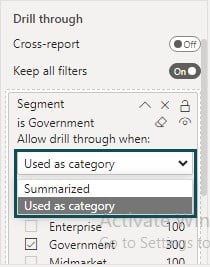
Step 5: Publish and Share the Report:
• Save your Power BI report and publish the report to the Power BI service.
• Share the Power BI report with other users, and they will be able to utilize the drill-through functionality to explore detailed data.
Note: You can also enable the cross-report Drill through feature to Power BI drillthrough to another page in the same Power BI service workspace or connect multiple reports with related contents and pass filter context.
Examples
Now, let’s understand Drill through functionality in Power BI with the help of some examples.
Example #1
In this example, we will create three reports, i.e., Sales by Segment, Product and Time Periods, Sales by Segment, and Product and Sales by Segment, and apply drill-through functionality using the above steps. For this example purpose, we have used the Financials dataset.
Step 1: Load the Financials dataset to Power BI and drag the fields from the Data pane to create the reports.
We have selected the donut chart for the Sum of Sales by Segment from the Visualization pane.
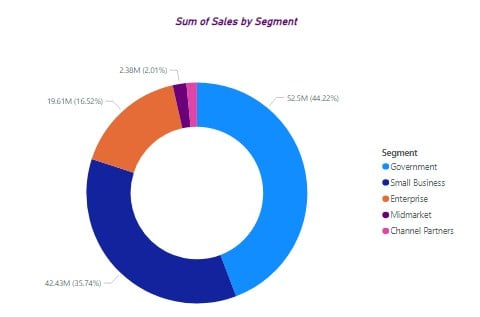
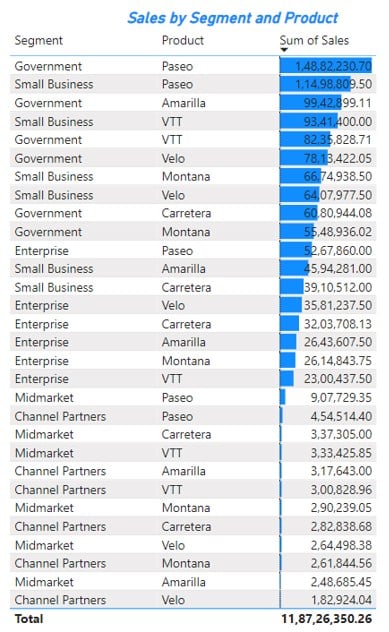
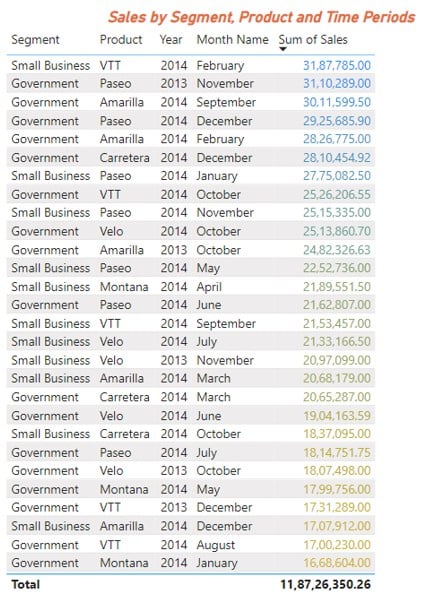
Step 2: Add the drill-through fields to the Drill through section in the Build Visual section of the Visualization pane on the drill-through target report page
In this case, we will add the Segment field to the Drill through section in the Sales by Segment, Product, and Time Periods report page which is the drill-through target report page.
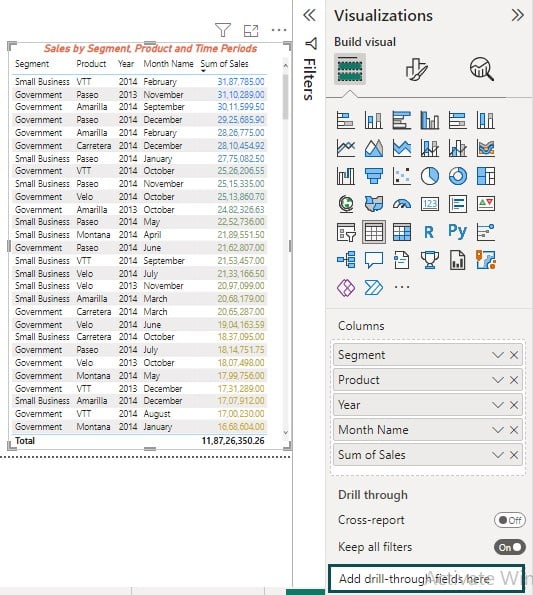
Once you add the Segment field to the Drill through section, you will notice a back or drillthrough button is enabled on this report page, and all the values for the Segment field are displayed.
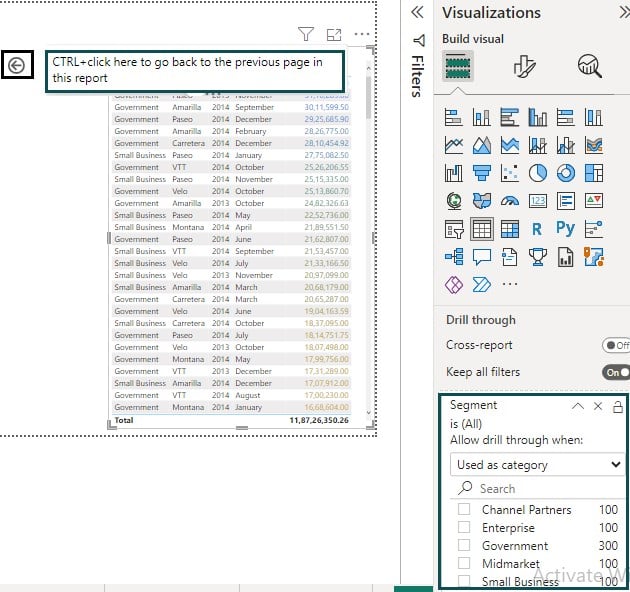
Step 3: Repeat the same process in Step 2 to the Sales by Segment and Product to add a drill-through field to the Drill through section. You would notice a similar Power BI drillthrough button on this report page as well.
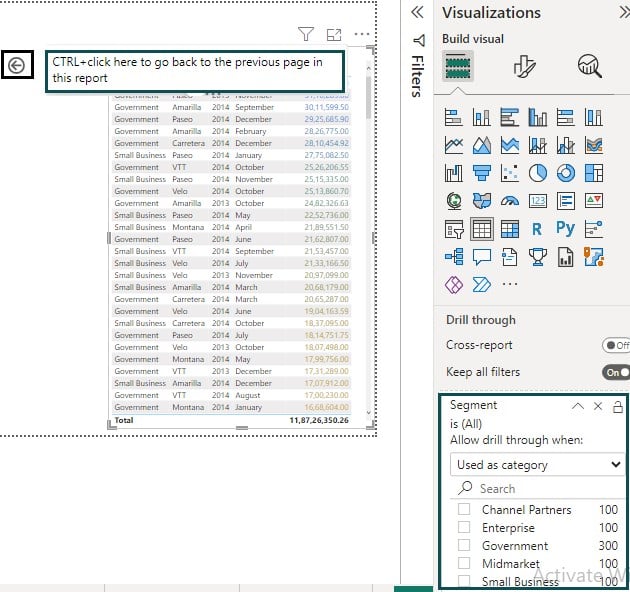
Step 4: Navigate to the source report page and pass all the applied filters to the drill-through target report page.
Here we need to perform drill through on the Sales by Segment report page, which is the source report page and drill through the target report page, i.e., Sales by Segment and Product and Sales by Segment, Product and Time Periods report pages.
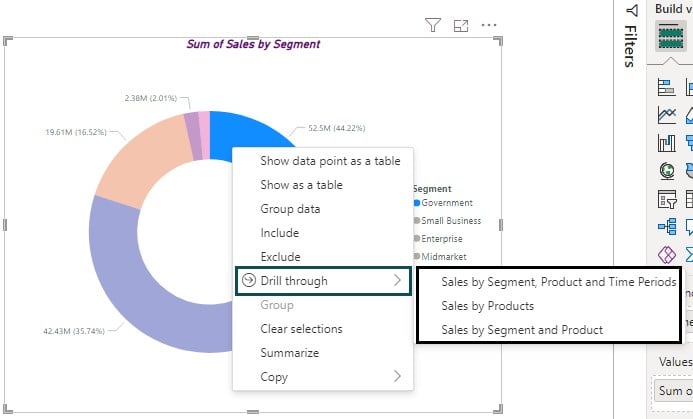
Step 5: Choose the Sales by Segment and Product option to perform the Drillthrough to another page. Power Bi will pass the Government Segment as a context filter to the Sales by Segment and Product report page and only filtered data specific to Government Segment shall be visible on the report page.
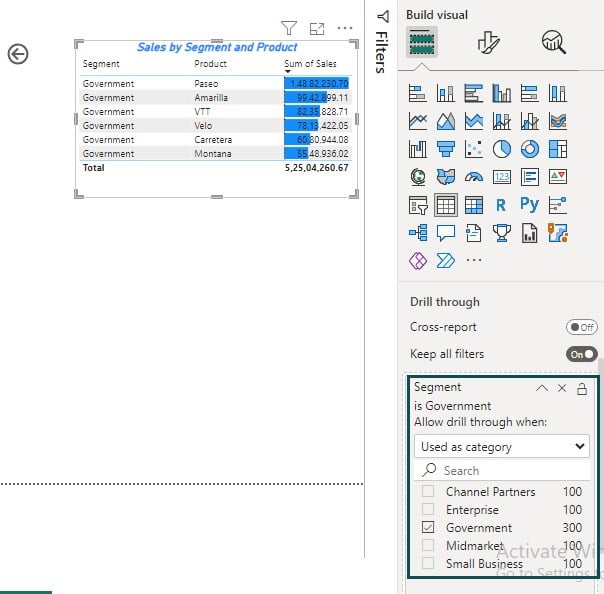
Step 6: Click the back button to navigate to the source report page.

Once you click the back button, Power BI will automatically redirect you to the source report page i.e. Sum of Sales by Segment report page.
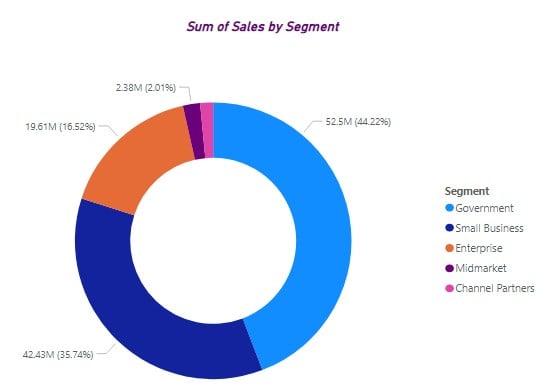
In the above example, you can also choose the Sales by Segment, Product and Time Periods from Drill through the context menu. Power BI will pass the context filter to filter the dataset, as shown below.
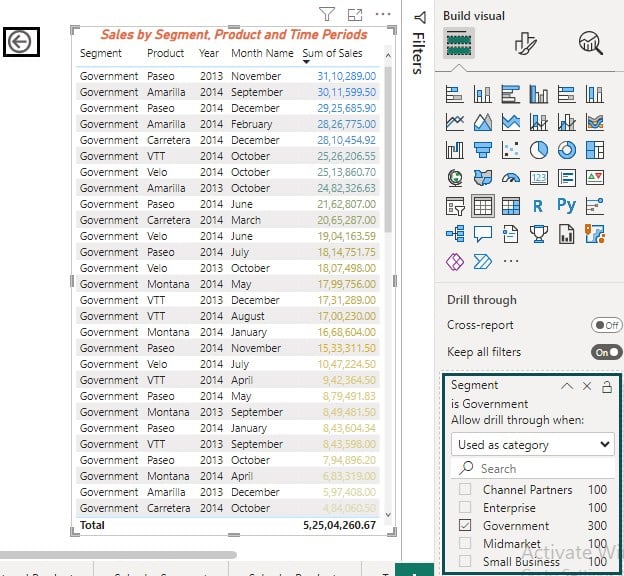
Once you click on the back button, Power BI will automatically navigate you to the source report page, i.e., Sales by Segment report page.
Example #2
In this example, we will apply Power BI drillthrough from card visual. For this example, we have used the Financials dataset. The steps required for this drill through example are highlighted as follows:
Step 1: Import the dataset to Power BI and create 2 visuals i.e. Total Sales and Sales by Product.
Total Sales is a card visual and Sales by Product is a Stacked Bar chart. These two charts are created by selecting the respective chart type from the Visualization pane.
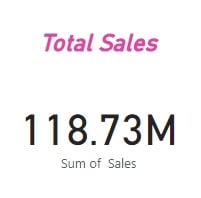

Step 2: On the Sum of Sales by Product report page, add the drill-through field by dragging the field to Add drill-through fields here in the Build visual section in the Visualization pane.
Here we have used the Sum of Sales as the drill-through field.
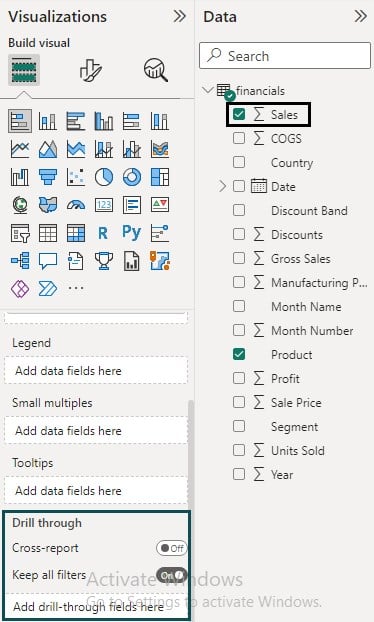
Once you add the Sum of Sales to the drill-through field, you will notice a back or Drillthrough button enabled on the report page.
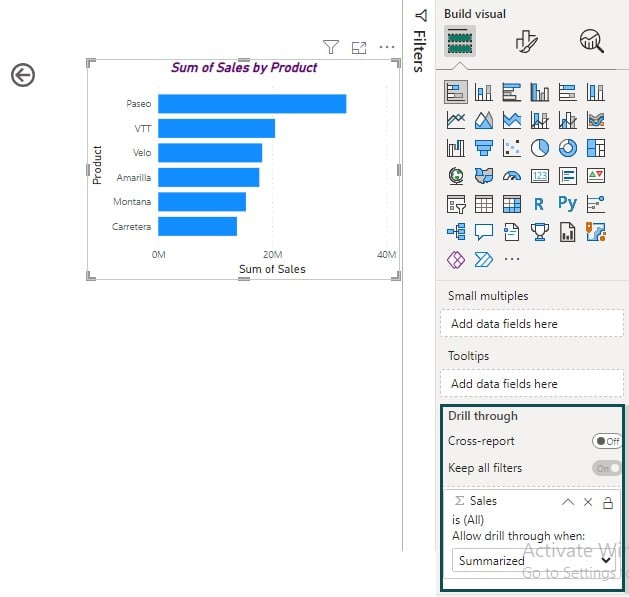
Step 3: Navigate to the Total Sales report page and right-click on the visual. Power BI will display the context menu where you can select the Drill through option. Choose Sales by Products to perform the Power BI drillthrough to another page.
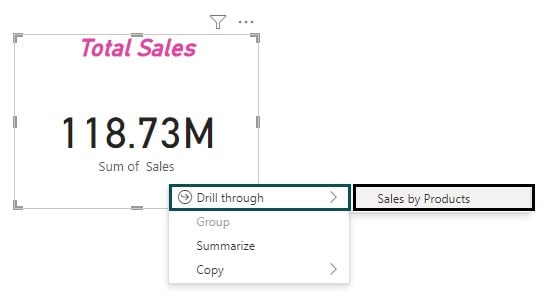
Power BI will navigate to the Sales by Products report page.

Step 4: Click on the back button on the Sum of Sales report page.
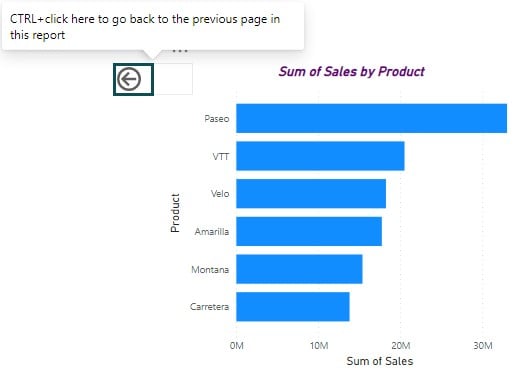
Power BI will navigate you back to the Total Sales report page.

Important Things to Note
Important things to note about the Drillthrough in Power BI are:
- Power BI Drillthrough functionality is available in both Power BI Desktop and the Power BI service.
- You can create multiple drill-through pages in your report, each focusing on different fields or aspects of data.
- Drillthrough actions can be customized based on the specific requirements of your data model and analysis needs.
- If you are using Drillthrough from the card, ensure that the card must use the same field used in the drill-through page. Otherwise, the Drillthrough functionality won’t work.

Frequently Asked Questions (FAQs)
In Power BI, drill through and drill down are both interactive data exploration features that allow users to navigate from summarized information to more detailed data. However, there are some differences between the two:
There could be several reasons why the Power BI drillthrough is not working as expected. Some of the common causes include:
• Drill-through is not enabled: Ensure that drill-through is enabled for the specific visual or field you are trying to drill through. You can check this by right-clicking on the visual or field and selecting “Drillthrough” from the context menu.
• Drill-through actions not defined: Drill-through actions need to be defined in Power BI Desktop to specify the target page or report that should be opened when drilling through.
• Incorrect filters or relationships: Drill-through can be affected by incorrect filters or relationships defined in your Power BI model. Double-check the relationships and filters in your data model.
• Security restrictions: If you are using row-level security (RLS) or other security measures, make sure that the user performing the drill-through action has the necessary permissions to access the target page or report.
The current drill-through filter doesn’t support drilling multiple values in Power BI. The Drill-through filter is specifically designed to provide granular information for a single data point or field. If multiple values are selected then the drill-through filter will be disabled.
Recommended Articles
This has been a guide to Power BI Drillthrough. Here we learn how to set up drillthrough filter in Power BI reports with examples. You can learn more from the following articles –

Leave a Reply