What is Power BI Natural Language Query (NLQ)?
Power BI Natural Language Query (NLQ) is a functionality offered by Power BI that enables users to ask questions in simple, plain English to get an understanding of your dataset. Power BI uses these queries to provide answers in the form of data visualizations, data tables, graphics, or other formats that help users quickly create data visualization. This feature is helpful for Power BI users to explore and get insights about their datasets and create data visualization without requiring any technical know-how to author those reports. The best part of this is you can use the Power BI Natural Language Query with all versions of Power BI, including Power BI Desktop, Power BI Service, and the Power BI mobile app.
Power BI NLQ offers a lot of benefits that include:
- Easy access to data visualization: You can create data visualization without having to acquire technical expertise
- Quick data insights: You can get faster data insights without using any complex DAX queries or performing any calculations
- Easy to write queries: You can write simple, plain English questions to display data visualization with the option of adding filters
In the next section, we will go through how to use natural language queries in Power BI.
Table of contents
Key Takeaways
- Power BI Natural Language Query (NLQ) enables users to ask questions in simple plain English in Power BI and get answers in the form of data visualizations, data tables, graphics, or other formats.
- This feature is quite useful for Power BI users to explore and get insights about their datasets without any technical expertise.
- It works with all versions of Power BI, including Power BI Desktop, Power BI Service, and the Power BI mobile app.
- You can use Power BI Natural Language Query on a dashboard, in a report, or create a Q&A visual in a report.
How to use Natural Language Query in Power BI?
When you create a natural language query in Power BI, it interprets your question and provides the relevant results. For example, if you want to perform a deep dive into eCommerce sales figures, you can refine your queries by asking:
- What are the total sales for October 2018?
- Which product category had the highest sales in 2019?
- Who are the top 10 customers by revenue?
- Display the top 10 cities with high sales in a pie chart.
Based on these questions, Power BI will automatically generate visualizations and tables providing data insights and trends using the underlying dataset.
You can use Natural Language Query in Power BI to
- Use Q&A to explore a dashboard
- Use a Q&A visual in a report
- Create and save Q&A results to a dashboard or report
- Create a Q&A visual in a report
To use Natural Language Query in Power BI, follow the instructions outlined below:
Step 1: Open your existing Power BI report or dashboard in Power BI Service.
Step 2: On the dashboard screen, click on Ask a question about your data available at the top of your screen.

Step 3: Power BI Service will navigate you to a Q&A page along with a few suggested questions based on your dataset.

Step 4: Type your questions in the Q&A question field. As you type, Power BI will provide suggestions to choose from. You can also type your questions using Natural Language Query.

Notice that Power BI suggests various ways to word the question by using terminology from the underlying semantic model. The Power BI suggested terms are underlined in blue.

Power BI will generate the visualization based on the entered questions using the Natural Language Query.
Step 5: Improve your questions to generate specific visualizations or filters you want to visualize.
Examples
In this section, we will go through a few examples highlighting the use of Natural Language Query in Power BI.
Example #1
In this example, we will demonstrate using Power BI Natural Language Query on a Power BI dashboard. Before we start the demo, you need to ensure below pre-requisite requirements
- Account in Power BI Service
- You should have a Power BI Dashboard deployed in the Power BI Service
To use Power BI NLQ to create a visual on your dashboard, follow the instructions below:
Step 1: Open the Power BI Service portal in your browser, i.e., Microsoft Fabric (powerbi.com)
Step 2: Click on My workspace from the left navigation pane.

It will display all the Power BI components you have published to Power BI Service.

Step 3: Click on a dashboard link. It will take you to the dashboard window.

Step 4: On the dashboard screen, click on Ask a question about your data which is available at the top of your screen.

Step 5: Power BI Service will navigate you to a Q&A page along with a list of suggested questions based on your dataset.

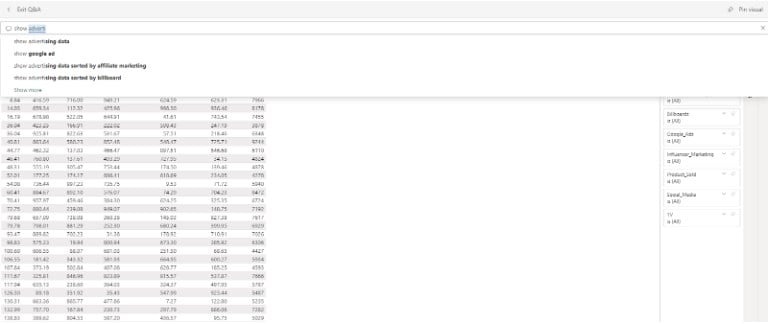
Step 6: You can select any of the suggested options to add them to the question box and refine your question to search for a specific query.
When you write questions using the Natural Language Query, Power BI provides autocomplete suggestions, visualization, restatements, and feedback that you can leverage to refine your queries.

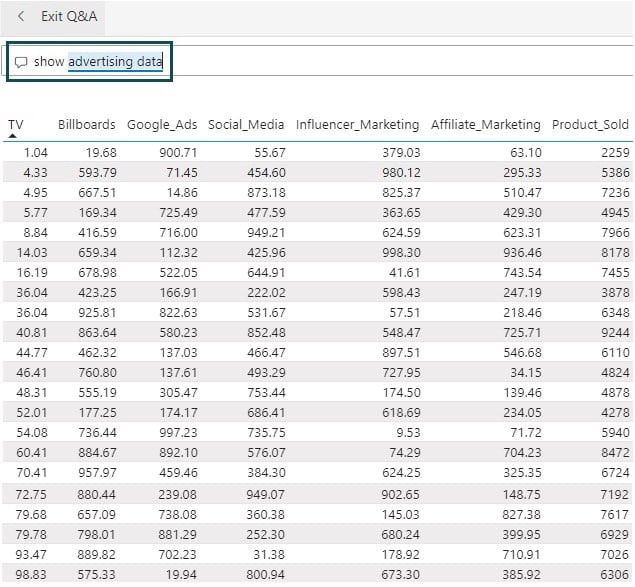
You will notice that there are texts highlighted in blue and red color. The Power BI suggested terms are underlined in blue i.e. influencer marketing text in this case. Similarly, the text that Power BI fails to understand is highlighted in red color i.e. revenues.
Step 7: Use the Pin visual option to pin the visual to the dashboard.

Step 8: Select the existing dashboard option to pin the visual to the dashboard and click on Pin.

This will pin the visual to the dashboard.

Step 9: Click on the Exit Q&A.

You will see the pinned visual in the dashboard.

Example #2
In this example, we will demonstrate using Power BI Natural Language Query in a Power BI report. For this demo, we will use an existing report i.e. Power BI Reports available in Power BI Service.
To use Power BI NLQ to create a visual in your Power BI report, follow the instructions below:
Step 1: Open Power BI Service in your system.
Step 2: Click on My workspace from the left navigation pane and click on the Power BI Reports.

Step 3: Click on the Edit option.

Step 4: Click on the New page icon (+) at the bottom of the page to create a new page.

Step 5: On the top of the page, click on the Ask a question option.

Step 6: Power BI will display a Q&A box with visualization suggestions in the report canvas.

Click on Show all suggestions to view all the suggestions.

Step 7: You can either select one of the Power BI suggestions or type Natural Language Query in the question text box.
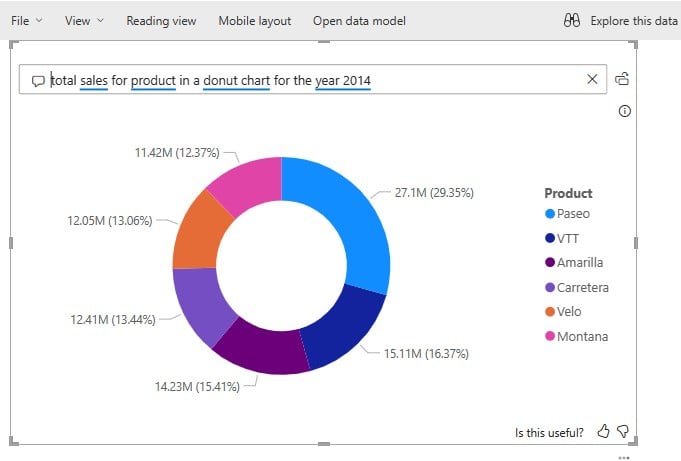
Here we have refined the query to create a visual showing the total sales for products in a donut chart format for the 2014 financial year.

Step 8: Click on the Ask a question option to add more visuals to the report canvas.

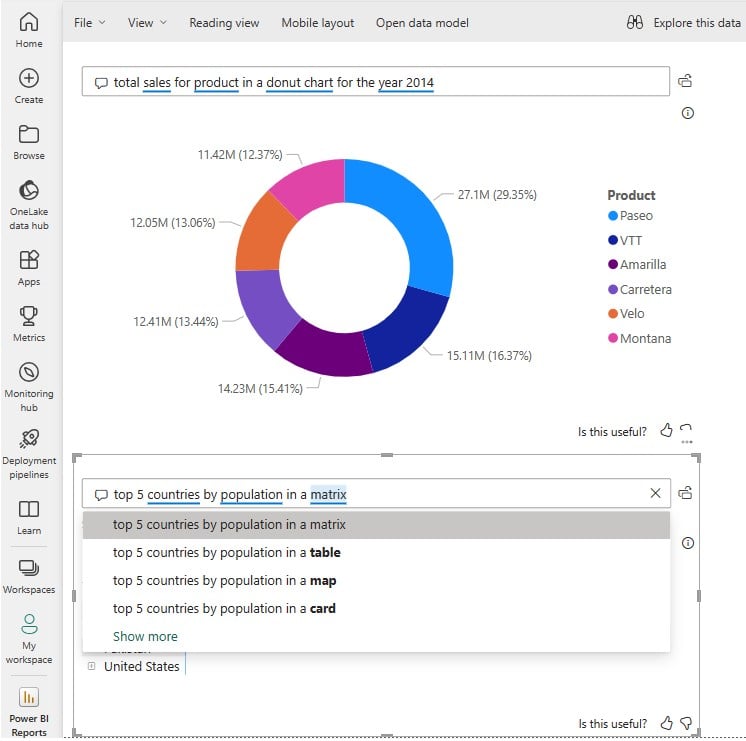
Step 9: Type your question using the Natural Language Query to visualize the top 5 countries by population in a matrix visual.

Step 10: You can repeat the above steps to add more visuals to the report canvas. Here, we have added the top 10 countries by GDP and CPI visualization.

Step 11: Once the changes are completed, you can pin the visuals to a dashboard or simply save the changes by choosing the options.

Example #3 – Create Q&A visual in a report using Power BI NLQ
In this example, we will demonstrate creating a Q&A visual in a Power BI report using the Power BI Natural Language Query. For this demo, we will use an existing report i.e. Power BI Report as mentioned in Example 2.
To use Power BI NLQ to create a visual in your Power BI report, follow the instructions below:
Step 1: Open Power BI Service in your system
Step 2: Click on My workspace from the left navigation pane and click on the Power BI Reports.
Step 3: Once the report opens in Power BI Service, click on the Edit option.

Step 4: On the Power BI Reports page, navigate to the Visualizations pane and click on the Q&A icon in the Build visual tab.

This will create a new Q&A visual in the report canvas.

Step 5: Select the Q&A visual and drag the border to resize the visual as per your requirements.
Step 6: Type the Power BI Natural Language Query to build a visual in the report canvas.

Step 7: Once completed, click on Save to save the changes you have made.
Important Things to Note
- Currently, Natural Language Query in the English language is supported in Power BI through the Spanish language and is available in the preview.
- Power BI Natural Language Query is highly effective when your underlying data is well-structured, and the relationship is established.
- To leverage the Power BI NLQ, ensure that you are very specific in your questions to achieve more accurate results.
- Power BI highlights errors for the input texts entered using the Natural Language Query that it fails to understand.
- As much as possible, try to utilize the Power BI NLQ suggestions and auto-complete features to formulate your queries.
Frequently Asked Questions (FAQs)
Power BI Natural Language Query comes as a bundled feature in Power BI. You don’t have to pay anything additional other than the licensing cost associated with Power BI. For example,
– If you are using Power BI Desktop, you will have free access to Natural Language Query.
– If you are using Power BI Service, you will have limited access to the Natural Language Query free version.
– For Power BI Pro and Premium per-user capacity, you will have full access to the Natural Language Query. You will have to pay the licensing cost.
– For Power BI Premium per user capacity, you will have full access to the Natural Language Query. The licensing cost in this case will vary depending on the capacity and size.
Yes, Natural Language Query can be easily integrated with other Power BI features. You can use it to explore data within visuals, dashboards, and reports. However, in terms of third-party integration, it has a limitation that the official integration exists only with a few partners like Azure Cognitive Search.
You can ask a wide range of questions using Natural Language Query. These include:
– Asking about trends in your dataset
– Performing data aggregations
– Applying data filtering
– Comparing the datasets
– Sorting or ranking the dataset
Some of the examples are provided below:
“What was the top-selling product last quarter?”
“Show me sales trends for different regions over the past 5 years.”
“Which customers spent the most in last year?”
“Filter this data by year and product category.”
Power BI NLQ supports different data sources that include:
– Import mode
– Live connect mode with on-premises SQL Server Analysis Services, Azure Analysis Services, or Power BI datasets/semantic models.
– DirectQuery with Azure Synapse Analytics, Azure SQL, or SQL Server 2019.
– Other sources may work in direct query mode. However, they are not officially supported.
Recommended Articles
This has been a guide to Power BI Natural Language Query. Here we learn how to use NLQ in power BI, with examples, and points to remember. You can learn more from the following articles –

Leave a Reply