
What is Bidirectional Cross-Filtering in Power BI?
Bidirectional cross-filtering in Power BI refers to the ability to apply filters on both sides of a table relationship. It allows developers, report creators, or data modelers to explore different filtering choices to control the flow of data using the existing table relationships. When you apply bidirectional cross-filtering to any relationship, it pushes the filter context to another related table on the other side of a table relationship.
Hence, this functionality is extremely useful in solving complex data modeling in excel scenarios, especially with many-to-many relationships. The bidirectional 0 feature is a useful control mechanism to set the filter direction to both sides of the tables thereby maintaining consistency.
Key Takeaways
- Bi-direction cross-filtering is a valuable feature that sets the filter direction to both sides of the tables, thereby allowing the choice to control the flow of data using the existing table relationships.
- It works on established table relationships and is best suited for complex data models where you have many-to-many relationships.
- There are multiple ways you can apply bidirectional cross-filtering, which include using Manage relationship and DAX functions.
- Bidirectional cross-filtering offers several benefits, such as flexible data analysis, deeper insights, cause-effect analysis, etc.
- Have a good understanding of your data model and the established relationship between the tables to avoid any unexpected behavior or inconsistent results in your data.
How to use Bidirectional Cross-Filtering in Power BI?
There are multiple ways to use Power BI bidirectional cross filtering. Depending on how you want to implement it, you can choose one of the options highlighted below.
Using Manage Relationships:
Step 1: Import the datasets into Power BI Desktop using the Get data option.
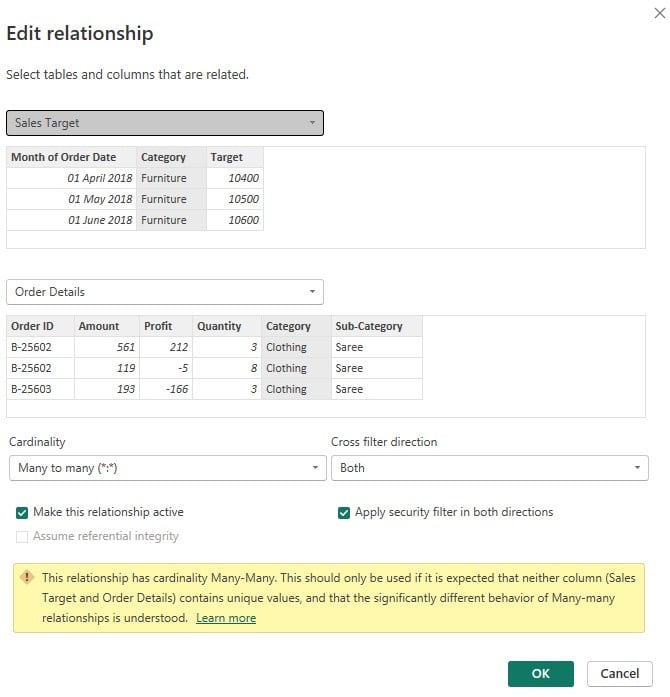
Step 2: Navigate to the Modelling – Manage relationships. Click on the Edit button to open the Edit relationship screen.
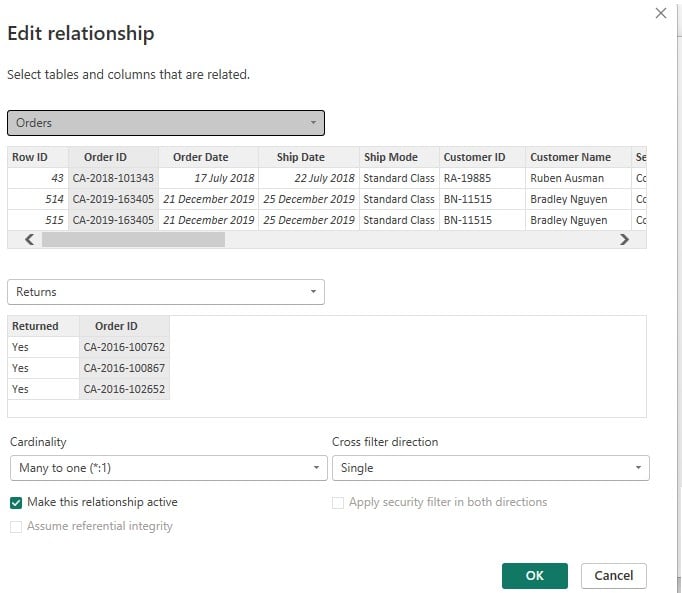
Step 3: Choose Both from the Cross filter direction dropdown and tick the Apply security filter in both directions checkbox. Click on OK to save the changes.
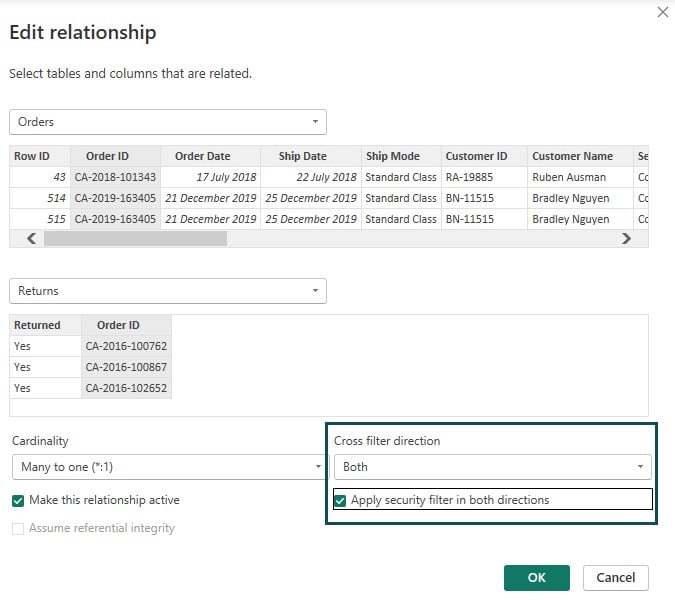
It will create a Power BI bidirectional cross filtering for both sides of the table relationship.
Using DAX Measures
You can apply the DAX function, such as CROSSFILTER, to apply the cross-filter in a bidirectional relationship to both the related tables.
A sample example of the DAX measure is provided below:
Customers Count Store Region:= CALCULATE([Count of customers], CrossFilter(Sales[CustomerId], Customer[Id], none ) ,UseRelationship (Customer[RegionId], Region[Id]))
Examples
In this section, we will demonstrate the bidirectional cross-filtering in the Power BI Scatter chart using three different scenarios.
Example #1
In this example, we will demo bidirectional cross-filtering in Power BI using E-commerce Data data. E-commerce Data contains sales details from the US e-commerce websites and has three different files.
- List of Orders- contains purchase information. The information includes ID, Date of Purchase, and customer details
- Order Details- contains order ID, with the order price, quantity, profit, category, and subcategory of product
- Sales target- contains the sales target amount and date for each product category
To use Power BI bidirectional cross filtering, follow the instructions below:
Step 1: Import the E-commerce Data in Power BI Desktop using the Get data option and load it into Power BI.

Step 2: Navigate to the Modelling – Manage relationships pane.
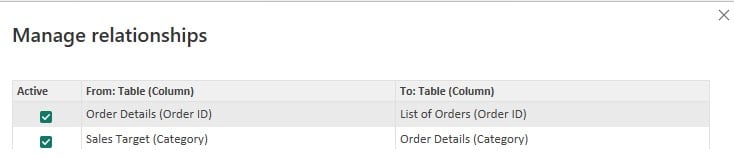
Step 3: Select an active relationship and click on Edit. Select Both from the Cross filter direction dropdown and check the Apply security filter in both directions checkbox. Click on the OK button.
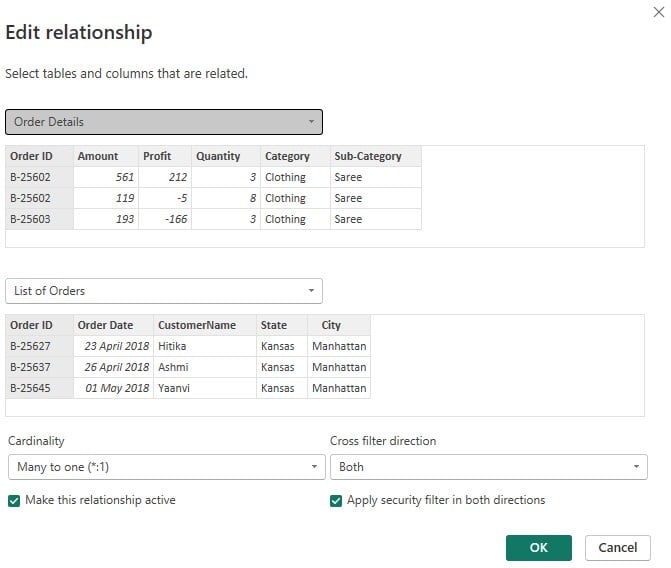
Similarly, define the cross-filtering option for all the tables.
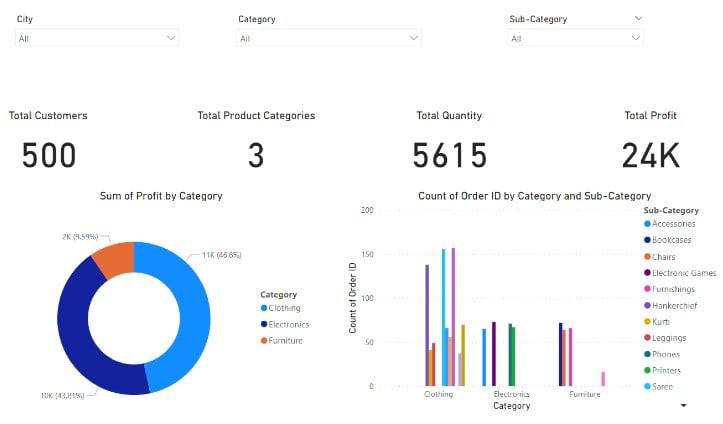
Step 4: Once the relationships are established, and cross-filter conditions are set up, navigate to the Visualizations pane to choose the visuals you want to create in the report canvas.
Here, we have added slicers, card visuals, a donut chart, and a clustered column chart in our report.
Step 5: Add the customization options to your report by navigating to the Format your visual tab and configuring the customization.
Step 6: Save the changes. It will create a Power BI report in the report canvas.
Example #2
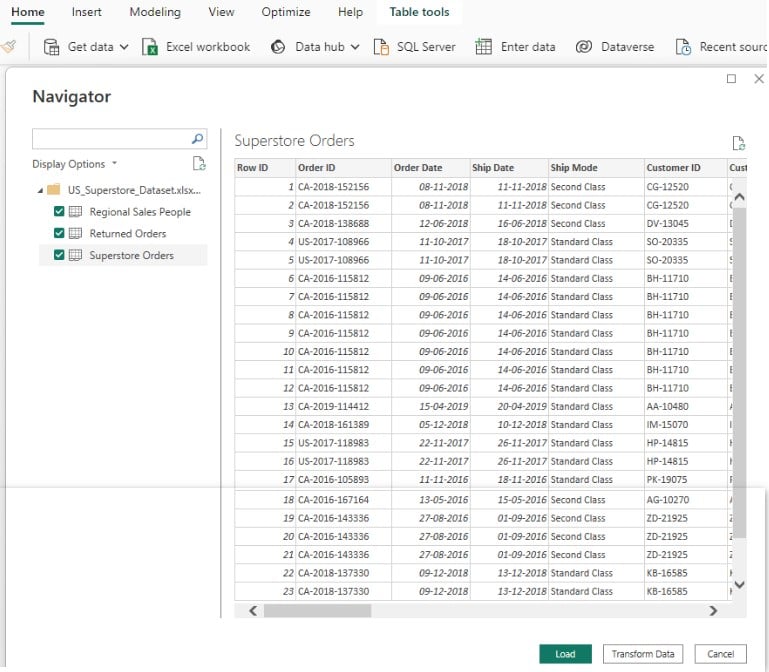
In this example, we will use the Power BI bidirectional cross filtering using the US_Superstore_Dataset dataset. US_Superstore_Dataset contains the sales details of a US superstore across different product categories and regions in the US. It contains three datasets.
- Superstore Orders – contains the order details such as product category, sales, ship mode, customer details
- Regional Sales People – contains salespeople and region
- Returned Orders – contains the list of order details of the returned products
The instructions for using bidirectional cross-filtering are highlighted below:
Step 1: Import the US_Superstore_Dataset dataset into Power BI using the Get data option. Click on Load to load data into Power BI.
Step 2: Navigate to the Model View in the Power BI Desktop.

Step 3: Select an active relationship and click on Edit. Select Both from the Cross filter direction dropdown and check the Apply security filter in both directions checkbox. Click on the OK button.
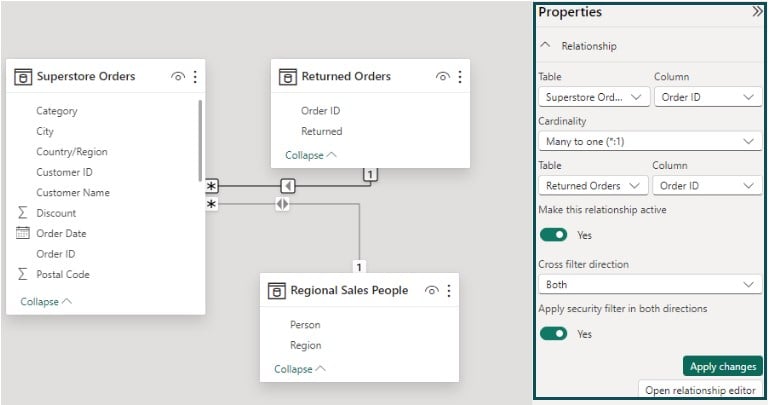
Similarly, you can specify the cross-filtering option for all the remaining tables.

Step 4: Save the changes and create your visualization in the report canvas.

Example #3
In this example, we will demo the plotting of the Power BI Ribbon chart using the Global Product Revenues dataset. The Global Product Revenues dataset contains the global product revenues across multiple countries. It dataset has 2 files
- Country-wise Product Sales – contains the product sales details
- Tax Rate – contains the tax regime applicable to each country
To use bidirectional cross-filtering, follow the steps outlined below.
Step 1: Import the Global Product Revenues dataset into Power BI Desktop and load it into the Power BI.

Step 2: Navigate to Modelling – Manage relationships and configure the cross-filter options in the Edit relationship screen. Click on OK to save the changes.

Once you save the changes, you can create your report in the report canvas following the steps highlighted in example 1.

Benefits
The key benefits of using Power BI bidirectional cross filtering include:
- Flexibility in data analysis: By applying bidirectional cross-filtering, you have flexibility in exploring data in different filtered contexts and its impact on the related datasets, helping you with data analysis
- Intuitive reports and dashboards: Allows you to interact with various Power BI reports and dashboards intuitively by applying filters to both sides of the tables.
- Data insights: Bidirectional cross-filtering can help you sneak through the contextual data insights and explore data from different contexts. It helps you to understand the impact of the filters on overall results and assess the changes by applying different variations.
- Seamless data modeling: It helps you to achieve data filtering in complex data models, especially in many-to-many relationship scenarios. You can easily avoid complex DAX formulas or the creation of calculated columns to save effort and resources
- Assessment of cause-and-effect relationships: You can explore the different causation models using the bidirectional cross-filtering.
Challenges
Despite several benefits offered by Power BI bidirectional cross filtering, you need to be aware of various challenges associated with this feature. These challenges include:
- While dealing with large datasets, more bidirectional cross-filtering may significantly impact the query performance. It, in turn, increases resource utilization and degrades the system’s performance.
- Too much filtering may create added complexity to the data model and result in unexpected results, especially in the case of ambiguous relationship tables.
- In some instances, Power BI bidirectional cross filtering may result in circular dependencies between the tables. It will impact the expected output and create a never-ending loop-like situation. It requires you to evaluate the data model to avoid such circular trap carefully
- Bidirectional cross-filtering requires a good understanding of data modeling and relationship hierarchy to ensure that you can apply accurate contextual cross-filtering
- Using DAX functions to achieve Power BI bidirectional cross filtering will require a degree of technical expertise and a good understanding of DAX expressions.
Important Things to Note
- Bidirectional cross-filtering requires additional processes which may negatively affect the query performance. The more bidirectional cross-filtering, the more adverse the query performance will be.
- Changing the cross-filtering configuration from bidirectional to single direction may impact your reports and dashboards. Be cautious before you change the existing bidirectional cross-filtering for existing relationships.
- By default, the cross-filter direction is not set as bidirectional, and hence, you need to set it up manually in the Manage relationship.
- You can disable or turn off existing bidirectional cross-filtering in Power BI to improve your query performance.
- Ensure that you have thoroughly tested your data results post-implementation of the Power BI bidirectional cross filtering in your data model.
Frequently Asked Questions (FAQs)
There are multiple ways to turn off default bidirectional cross-filtering in Power BI. These include:
• You can turn off default bidirectional cross-filtering for the entire visuals in your Power BI Desktop by navigating to File – Options and settings – Options – CURRENT FILE – Query reduction. Uncheck the Disabling cross highlighting/filtering by default option under the Reduce number of queries sent by section
• You can turn off the cross-filtering for your specific reports selectively by navigating to Modelling – Manage relationships – Edit. Disable cross-filtering between specific visuals in the Edit relationship screen by unchecking the Apply security filter in both directions check box options.
Yes, you can control the relationships that have bidirectional cross-filtering enabled in Power BI. To control the relationships, follow the steps outlined below:
• Select an existing relationship and navigate to Modelling – Manage relationships – Edit
• In the Edit relationship screen, select Both in the Cross filter direction drop-down menu
• Check/uncheck the Apply security filter in both directions check box option as per your requirements to control the bidirectional cross-filtering for that relationship
Alternatively, you can also use DAX functions such as CROSSFILTER for dynamic control filtering direction as per your calculations requirements. This will allow you to control the cross-filter direction between the fields defined by a relationship.
Bidirectional cross-filtering enables you to filter datasets in both directions along a relationship between two or more tables. When you enforce a bidirectional cross-filtering option, it results in pushing the filters to both sides of the relationship providing more flexibility to remediate complex data modeling challenges.
When you configure a Single cross-filtering direction, filtering happens only in one direction. With bidirectional i.e. both cross-filtering directions in multiple relationships, the filtering becomes easy and consistent across the tables.
For example: If you have three tables say Orders, People, and Returns which have established relationships, when you apply bidirectional cross-filtering on Orders, it automatically filters relevant datasets on People and Returns tables thereby providing consistent results.
Disabling bidirectional cross-filtering on an existing relationship can have significant repercussions on a case-by-case basis. Some of them are highlighted below:
• The existing relationship will change from bidirectional to single direction and existing filters will be impacted. This means filters applied to one side of the table will apply to many sides but not vice versa.
• Any existing measures or calculations created on the existing bidirectional cross-filter will not work and will require changes to reflect accurate results.
• Any reports or analyses previously dependent on the existing filter will not project correct behavior and may require refresh post adjustments.
• For complex data models, disabling the cross-filter may impact query performances and hence require additional testing to validate the user performance.
• If you are using DAX functions on top of the filtered dataset, ensure that you revisit the calculation formulas and results to display accurate results.
Recommended Articles
Continue with these related resources when you want the next practical step in this topic.
- Power BI Tutorial
- Getting Started with Power BI
- Power BI Features
- Power BI Desktop Installation
- Data Types in Power BI
Explore the full Power BI Basics and Comparisons guide or browse Power BI Resources.