
Introduction to Predictive Analytics in Excel
Predictive analytics in Excel helps users look ahead instead of only looking at past data. You do not look at past data, but determine what will happen next. This can mean forecasting sales, predicting employee attrition, estimating demand, or spotting trends before they become problems.
The biggest advantage of Excel is its accessibility. Most professionals already use it daily, and predictive analytics Excel AI doesn’t require deep programming knowledge when you know what to do. Excel offers a range of built-in tools. These range from simple trend lines and forecasts to newer AI-driven features. These make prediction easier for non-technical users.
With recent updates, Excel has moved beyond just static formulas. Features like Forecast Sheets, Microsoft 365 Copilot, and Python integration allow users to apply machine-learning techniques while still working inside the spreadsheet environment. For many teams, this removes the need for separate analytics tools.
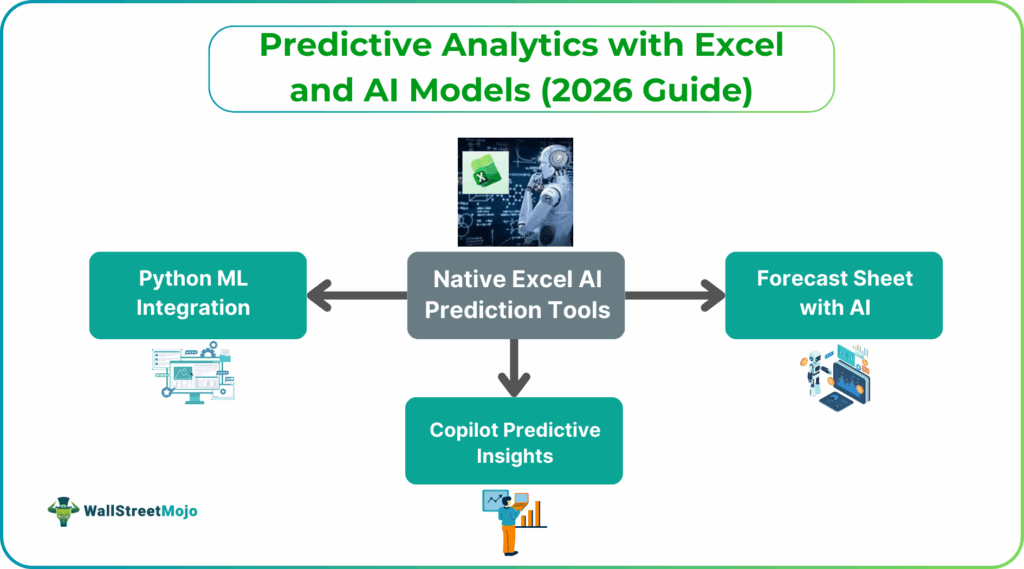
Native Excel AI Prediction Tools
Excel itself does not function like a machine-learning platform, it is more of a data manipulation and analysis assister. However, it includes several intelligent features that support predictive analysis. Over time, Microsoft has steadily embedded more AI-assisted capabilities into Excel, especially for Microsoft 365 users.
Earlier, Excel relied heavily on manual formulas, regression analysis, and charts. Today, it can combine automation, statistical models, and AI-assisted guidance to make predictions faster and more intuitive. This is because it has adapted tools like Forecast Sheets and Copilot, which reduce the need to understand complex formulas and statistical models.
Instead of building everything from scratch, users can now rely on Excel to suggest trends and surface insights automatically. This makes predictive analytics Excel AI more available for business users, HR teams, finance professionals, and analysts who are not data scientists.
#1 – Forecast Sheet with AI
The Forecast Sheet is one of Excel’s most practical predictive tools. It allows users to create forecasts with just a few clicks. There is no need to write formulas or code. Behind the scenes, Excel uses the Exponential Smoothing (ETS) algorithm, which is widely used in time-series Excel AI forecasting 2026.
This feature works especially well for data like sales, revenue, website traffic, etc. It is good for tasks that follows a time pattern. Excel automatically detects seasonality, handles missing data points, and generates confidence intervals so users can see both expected outcomes and uncertainty ranges.
Forecast Sheet is known for its simplicity. All you need to do is select the data, choose a future date, and Excel does the rest. For many business scenarios, this provides a reliable Excel forecast sheet AI without needing advanced modeling skills.
#2 – Copilot Predictive Insights
Microsoft 365 Copilot brings generative AI directly into Excel. It has changed the way users interact with data. Instead of manually building models or formulas, users can ask questions in plain language and receive insights instantly.
For example, users can prompt Copilot with requests like “predict next quarter’s sales,” “explain why attrition increased,” or “identify factors affecting overtime costs.” Copilot analyzes the data and applies appropriate logic. It presents results through summaries, charts, and formulas it will suggest.
Copilot does not replace analytical thinking, but it significantly lowers the barrier to predictive analysis. It helps users explore data faster, test assumptions, and understand trends without needing to know exactly which functions or methods to apply.
Advanced AI Modeling in Excel
For users who need deeper predictive power, Excel now supports advanced analytics through Python integration. This is a major leap forward because it combines Excel’s usability with Python’s data science capabilities.
Instead of exporting data to separate tools, analysts can build, run, and visualize machine-learning models directly inside Excel. This makes advanced modeling accessible to teams that already rely on Excel for reporting and decision-making. Advanced modeling is especially useful when simple trend lines are not enough.
#1 – Python ML Integration
Python in Excel allows users to write Python code directly in spreadsheet cells. This enables access to powerful libraries like pandas, scikit-learn, and statsmodels which are commonly used by data scientists.
With this integration, users can build predictive models such as linear and logistic regression, decision trees, random forests, and clustering algorithms. The results appear directly in Excel, making it easy to share and interpret outcomes. This feature bridges the gap between business users and advanced analytics. Analysts can experiment with machine-learning models while still delivering insights in a familiar Excel format.
Python integration transforms Excel into a powerful analytics workspace. It enables advanced modeling without leaving the spreadsheet environment. This helps analysts combine flexibility, depth, and ease of sharing results.
#2 – Automated Model Selection
Excel does not yet offer a one-click option that automatically selects the best machine-learning model. However, users can achieve a similar outcome by combining Copilot guidance with Python experimentation.
Copilot can suggest which modeling approach might suit the data, while Python enables users to test multiple models and compare results. By evaluating metrics such as accuracy, error rate, or precision, users can decide which model performs best. This approach encourages thoughtful analysis rather than just automation. Users remain involved in choosing models while still benefiting from AI-assisted guidance.
Advanced AI modeling allows Excel to handle complex prediction scenarios. Users can analyze multiple variables and find deeper insights. Excel thus evolves from a reporting tool into a strategic analytics platform.
Best Practices & Validation
No matter how advanced the tools are, predictive analytics Excel AI only works well when basic best practices are followed. If the data is poor or the analysis is done incorrectly, the results can be confusing or misleading.
Data cleaning is the foundation of predictive analytics Excel AI. The data should not have duplicates, missing values, or obvious mistakes. Even the best AI tools cannot give correct results if the input data is wrong.
Feature selection is also very important. Including too many unnecessary factors can reduce accuracy and make results harder to understand. It is better to focus only on the data points that clearly affect the outcome. Model validation helps ensure the predictions are reliable. This means testing the model on new data it has not seen before. Doing this builds confidence that the predictions will work in real-life situations and not just on past data.
Frequently Asked Questions (FAQs)
Excel AI enables predictive analytics by studying historical data to identify trends and patterns over time. It uses built-in tools such as Forecast Sheets, Copilot predictive models, and Python integration to generate future predictions. These tools allow users to get insights directly within Excel without complex setup.
The accuracy of Excel AI predictions depends on the quality and completeness of the data used. When data is clean, relevant, and well-structured, the predictions are more reliable. Accuracy can be further improved by testing models and updating them with new data.
Coding is not required for basic predictive features in Excel. Users can create forecasts and insights using built-in AI tools and natural language prompts. For advanced machine learning models, Python ML Excel can be used, but it is optional rather than mandatory.
Recommended Articles
Continue with these related resources when you want the next practical step in this topic.
- How To Use AI With Excel
- How AI Is Transforming Data Analysis In Excel (2026 Complete Guide)
- Excel AI And Machine Learning: Beginner’s Guide For 2026
- The Most Useful AI Features in Excel: Unlock Smarter Spreadsheets in 2026
- Top Skills for AI-Enabled Excel in 2026 (Must-Master List)
Explore the full Excel AI Automation and Analysis guide or browse Excel Resources.