What are Tableau Date Functions?
Tableau Date Functions are one of the critical features in Tableau Desktop that enable you to perform data manipulation, calculations, analysis, and build visualization using the data types that are in date or date time formats. When you add date fields to Tableau in the view or viz, Tableau creates an automatic date hierarchy with support to drill down, including additional capabilities to filter date-specific values and even support for specialized date format options.
Tableau Date functions support various built-in functions that allow users to perform different date operations in your dataset, such as date-based calculations, grouping, or other changes.
Table of contents
Key Takeaways
- Tableau Date Functions enable you to perform data manipulation, calculations, analysis, and build visualization using the data types that are in date or date time formats.
- These built-in functions in Tableau help you in performing Time Series Analysis, calculations, Data manipulations, Data Filters/Grouping, and Data Visualizations.
- Tableau support many Date Functions that can be used for your visualization requirements.
- Consider the limitations and performance aspects and be careful while using the syntax of these Date Function in your calculations in Tableau.
Why use the Date Functions in Tableau?
There are various reasons to use the Date Functions in Tableau.
- Time Series Analysis
- Using date functions in Tableau, you can perform trend analysis and observe data patterns over some time. For example, the growth of the population over ten quarters.
- You can also analyze the movement of data year-on-year or month-over-month to draw analytical comparisons of various critical metrics of your data. For example, a comparison of key economic indicators year-on-year.
- Tableau calculations
- You can perform calculations involving date fields such as duration between two key dates, adding two dates, date hierarchies or any other calculations in Tableau
- Data manipulations
- Tableau allows for the creation of calculated fields involving date fields, such as extracting day, week, month, year, etc., from an input date or validating a string in a date format.
- Data Filters/Grouping
- Tableau allows you to apply filters in Tableau to your visualization on date fields, such as filtering on a specific date or range of dates.
- Similarly, you can also group the data based on different data parameters, such as aggregate sales based on weeks, months, quarters, etc.
- Data Visualizations
- Create stunning visualizations for your dataset in Tableau involving date fields and clearly show the key information on the visuals.
Types of Date Functions in Tableau
Tableau supports many built-in Date Functions that you can use for your analysis or visualization requirements. We have outlined the key Tableau date function examples for your understanding.
- DATE
- This function converts a string, number, or date expression into a date format if the expression is in a recognizable format.
- To use this function, use the syntax provided below.
DATE (expression)

For example, DATE (“05/28/2024”) will return the input string in date format i.e. 28-05-2024
- It returns a date value for the input expression.
Let us look at an example to understand this function. For the demonstration purpose, we have leveraged the sales_dataset that contains the sales details across multiple product categories, including information such as inventory level, lead time, social media mentions, etc.
To use the DATE function in Tableau, follow the steps provided below
Step 1: Connect to sales_dataset in Tableau using the File Navigator.
Step 2: Right-click on the Data pane and select Create Calculated Field.

Step 3: In the calculation editor, specify the Date Function, i.e., DATE, and click on OK to save the changes.

Tableau has automatically created the field that is visible in the Data pane.
- DATEADD
- This function adds a specific number of date parts to any date value. The date part can be a day, week, month, year, etc.
- To use this function, you can use the following syntax.
DATEADD(date_part, interval, date)
date_part is a string constant that defines the part of the date to consider. Sample values are highlighted below
| date_part | valid values |
|---|---|
| ‘day’ | 1 – 31 |
| ‘week’ | 1 – 52 |
| ‘year’ | Four digit number |
| ‘month’ | 1 – 12 or “January,” “February,” and so on |
| ‘hour’ | 0 – 23 |
Interval refers to a value you want to add to the date_part. For example, adding one month to a specific date
For example, DATEADD (‘month’, 2, #2024-05-29#) will add 2 months to the input date and returns 29-07-2024 00:00:00
- It returns a date value as an output value
Let us look at an example to understand this function. In this example, we will create a calculated field using DATEADD using the sales_dataset.
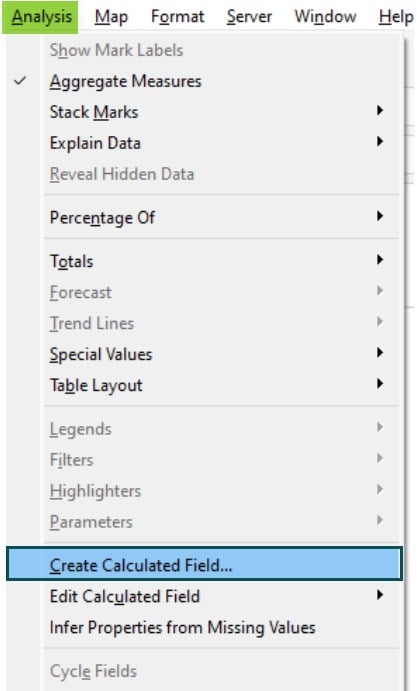
Step 1: Navigate to Analysis – Create Calculated Field…

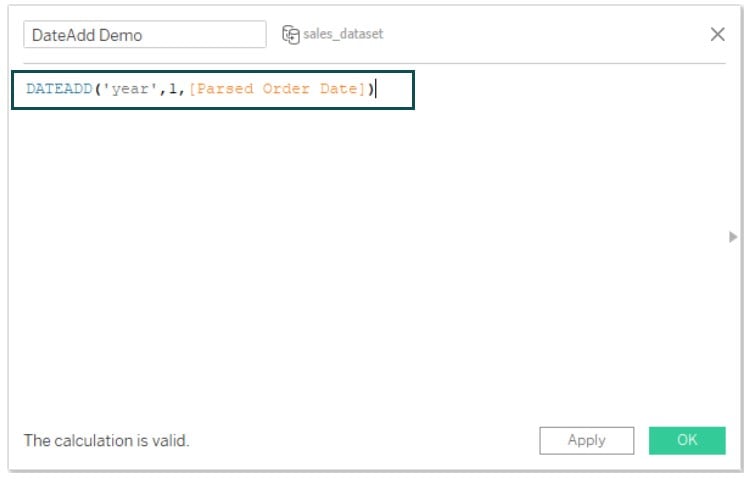
Step 2: Specify the logic using the DATEADD function in the calculation editor and click on OK.
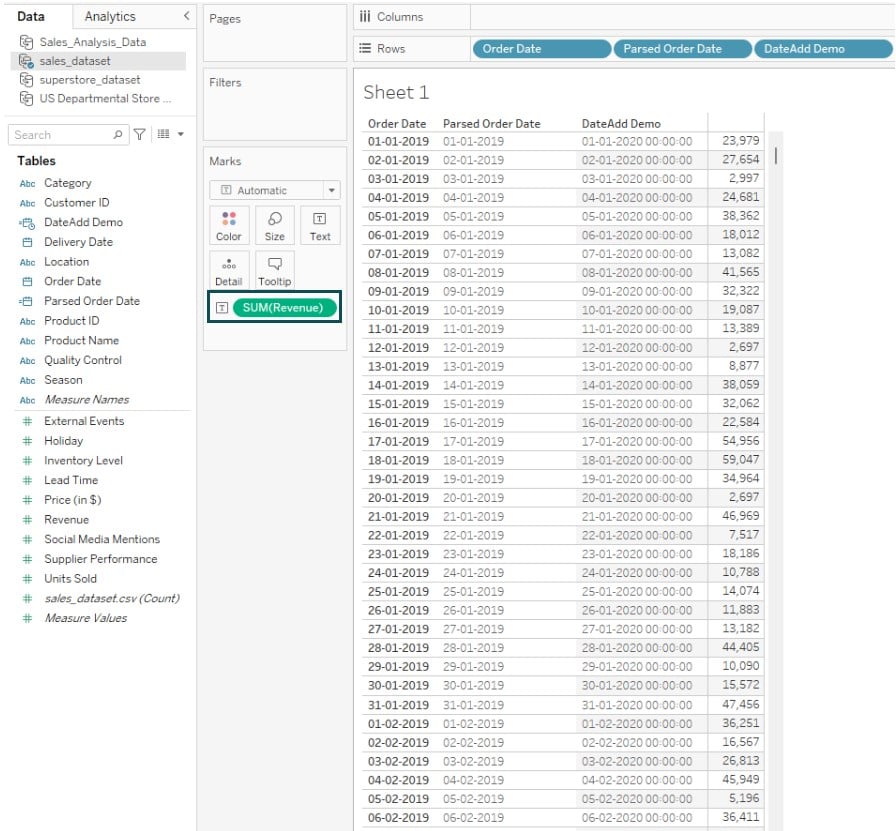
Here, we are adding one year to the Parsed Order Date using the DATEADD function.

Step 3: Drag the calculated fields to the Tableau view

- DATEDIFF
- This function calculates the difference between two dates, which can then be expressed in the units of date_part
- To use this function, use the below syntax
DATEDIFF(date_part, date1, date2, [start_of_week])

date_part input parameter is already defined in the previous example.
date1 and date2 are the two dates you need to input for calculating the difference
start_of_week indicates what day is considered as the starting day or the first day of the week, i.e., “Sunday” or “Monday.”
For example, DATEDIFF(‘week’,#2024-05-26#, #2024-05-27#, ‘monday’) returns 1 whereas DATEDIFF(‘week’,#2024-05-26#, #2024-05-27#, ‘sunday’) returns 0.
It is because in the 1st example, the start of the week is Monday, and hence, both the dates fall in different weeks. Whereas in the 2nd example, the start of the week is Sunday, and both the dates fall in the same week.
- It returns the number of parts that are in date, such as weeks, months, days, etc.
Let us now look at using the DATEDIFF function in Tableau using the sales_dataset. Here, we will create a calculated field using this function.
Step 1: Navigate to Analysis – Create Calculated Field. Specify the logic using the DATEDIFF function as shown below.

Step 2: Drag the newly created field to the Tableau view.

- DATEPART
- This function extracts the specified date part from the input date
- The syntax of this function is provided below.
DATEPART(date_part, date, [start_of_week])

For example, DATEPART(‘year’, #2024-05-29#) returns 2024.
- It returns an integer value
Now, let’s create another calculated field in Tableau using DATEPART function.
Step 1: In the calculation editor, specify the condition using the DATEPART function.

Step 2: Drag and drop the calculated field to the Tableau view for your data visualization

Note: There are similar functions in Tableau, such as DATETRUNC, DATEPARSE, and DATENAME, that you can use for your visualization requirements.
- DAY
- This function extracts the day of the month as an integer from an input date. The day value can only be an integer value between 1 to 31.
- DAY function has the below syntax.
DAY(date)
For example, DAY(#May 29, 2024#) returns 29.
- You can use similar functions such as WEEK, MONTH, QUARTER, or YEAR to extract the date parts, i.e., week, month, quarter, or year, from the input data.
To use this function in Tableau, follow the instructions below.
Step 1: Connect to the US Departmental Store in Tableau Desktop.
Step 2: Navigate to Analysis – Create Calculated Field.
Step 3: Specify the logic to extract the day from the Invoice Date and click on OK.

Step 4: Drag the field to the Tableau view.

- ISOQUARTER
- This function returns ISO8601 week-based quarter for an input date
- The syntax of this function is ISOQUARTER(date)

For example, ISOQUARTER DATE(“05/27/2024”)) returns 2
- Similar functions supported in Tableau include ISOWEEK, ISOYEAR, ISOWEEKDAY etc.
To demonstrate using ISOQUARTER function in Tableau, follow the steps below.
Step 1: Create a calculated field using the ISOQUARTER function in the calculation editor that opens. Click on OK.

Step 2: Drag and drop the field to Tableau view to use it in the visualization.

- MAX
- This function calculates the maximum value of an expression or the maximum value between two dates, i.e., the most recent date.
- If you are comparing two dates, then the date hierarchy will be maintained in the result.
- To use this function, follow the syntax provided below.
For example, MAX(DATE(“05/27/2024”), DATE(“05/29/2024”)) will return 29-05-2024.
- Similarly, you can also use MIN function to calculate the minimum date value
To use the MAX function in Tableau, follow the instructions outlined below:
Step 1: Specify the logic involving the MAX function in calculation editor. Click on OK.

Step 2: Drag the field to the Tableau view.

- NOW
- This function returns the current local system date and time and does not take any input arguments
- The syntax of this function is NOW()
For example, NOW() returns 29-05-2024-05-29 13:00:21
- If you are using any live data connection for your data source, this function may return the date and time applicable to the data source, which may be at a different timezone.
- Tableau also provides a TODAY function similar to NOW that returns only the current local system date.
To use NOW function in Tableau, follow the below instructions:
Step 1: Create a calculated field using the NOW function in the calculation editor and click on OK to save the changes.

Step 2: Drag the field to the Tableau view to create a visualization.

Note: Apart from highlighted functions, there are other Tableau date function examples that you can create following the Tableau date function documentation.
Important Things to Note
- You must use the correct format for date fields while using the Date Functions in Tableau. Otherwise, the output of these functions will differ a lot.
- Tableau follows a date hierarchy by default when you drag the date fields to the Tableau view. Ensure that you apply the right formatting for creating your data visualization.
- Certain date functions return dates and times that are applicable for the data source time zones. Be mindful if you are using such functions in Tableau, especially if the data sources are in different time zones.
Frequently Asked Questions (FAQs)
There are a few performance considerations you may keep in mind while using Tableau date functions.
• For complex and large datasets, using optimized date functions such as DATEPARSE may improve the transformation or calculations in Tableau.
• Similarly, data type conversion from a numeric field to a date string can be fast and efficient by using built-in Tableau date functions such as DATEADD.
• However, if you have any nested date calculations in a huge data volume dataset, then it may slow down your workbook.
There are no native or built-in date functions in Tableau for working with fiscal calendars. However, you can create manual workarounds such as creating calculated fields or custom calculations to achieve the same in Tableau.
Yes, you can compare the date ranges or periods in Tableau such as year-over-year or month-over-month to monitor the performance or any data comparison. There are multiple ways of doing this, for example using the DATEDIFF function or even creating calculated fields to perform the analysis.
The reasons why the date functions are important in Excel include:
• Perform data manipulation to your date fields, such as date add, subtract, and date type conversion to other data types, etc.
• Analyze the data involving date or date time fields in your dataset, such as monitoring sales month-over-month, date/month/quarter/year-wise data reporting.
• Interactive data visualization involving date fields where you can apply date filters, trend analysis, time-based data visualization, or data highlighting based on different dates.
• You can also perform a data refresh on a specific date time and trigger automation or calculations using date functions.
Download Template
This article must be helpful to understand the Tableau Date Functions, with its formula and examples. You can download the template here to use it instantly.
Recommended Articles
Guide to What is the Tableau Date Functions. We explain how to use date function in tableau with syntax, various types & its examples, and downloadable template. You can learn more from the following articles –

Leave a Reply