What are Relationships in Tableau?
Tableau Relationships are a dynamic and easy way to combine data from multiple logical tables stored in Tableau. They enable linkage between two tables through a standard set of fields called matching fields. Tableau relationships can be thought of as similar to a table join that allows you to query the relevant dataset from multiple tables.
Relationships don’t combine any tables or the underlying datasets, and the tables remain separate objects without any changes to the granular details.
Table of contents
Key Takeaways
- Tableau Relationships are dynamic ways to combine data from multiple logical tables stored in Tableau.
- They leverage matching fields to create a linkage between the tables.
- Relationships don’t combine any tables or the underlying datasets and the tables remain separate objects without any changes to the granular details.
- Tableau relationships provide Flexible data modeling, Dynamic data querying, and Multiple table linkage options and avoid any data duplication.
- Consider the advantages and disadvantages of Tableau relationships before you recommend using them.
Features
The key features of Tableau relationships are provided below:
| Features | Description |
|---|---|
| Flexible data modeling | Relationships allow you to create, edit, view, or remove any table linkage through an easy navigation interface without any changes to the logical tables. |
| Dynamic data querying | They allow you to fetch the dataset from the related tables without any need to specify the join or any complex query language. |
| Multiple table linkage | Relationships help you connect with multiple tables using matching fields with a choice of connection, i.e., many-to-many, one-to-many, many-to-one, or one-to-one. |
| Data aggregation | Tableau automatically aggregates the data via Viz based on the matching fields. |
| Avoid Data Duplication | Tableau automatically avoids any data duplicates from the related tables unlike join, where depending on the nature of join conditions, duplicate records can be included. |
How to Create a Relationship in Tableau?
To create a relationship in Tableau, follow the instructions outlined below:
Step 1: Connect your dataset to the Tableau interface. Once successfully imported, you will be able to view the dataset in the Data Source tab in Tabeau.
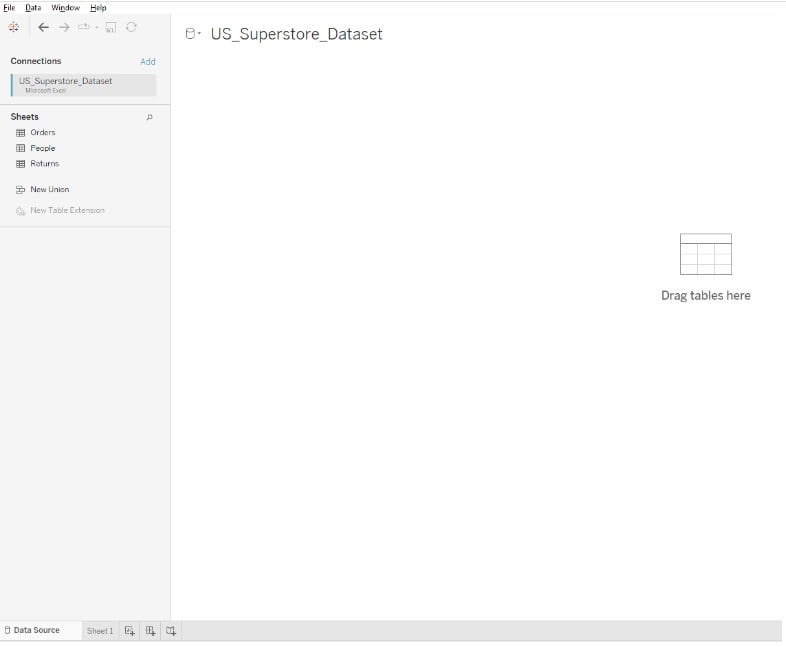
Step 2: Drag a table to the canvas in Tableau. Here, we have dragged the Orders table to the canvas.

Step 3: Similarly, drag another table to the canvas in the Data Source tab. Here, we have dragged the People table to the canvas. You will notice a noodle line between the two tables.
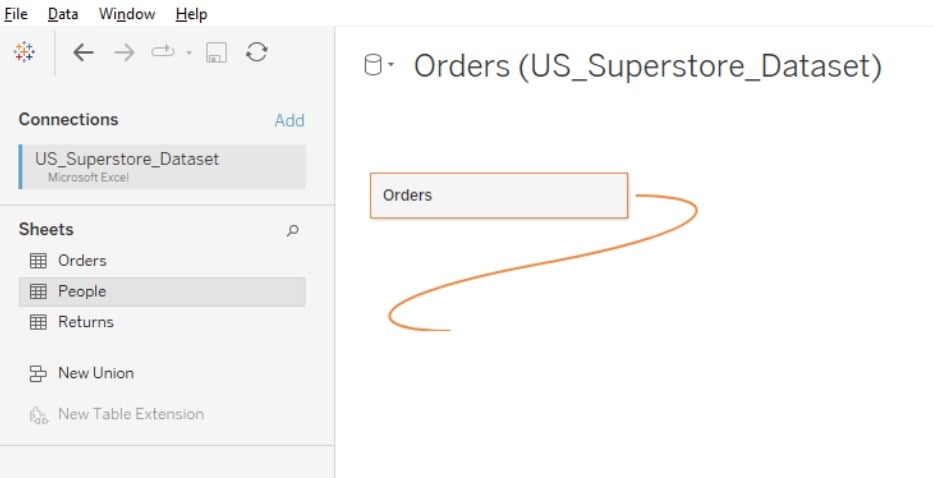
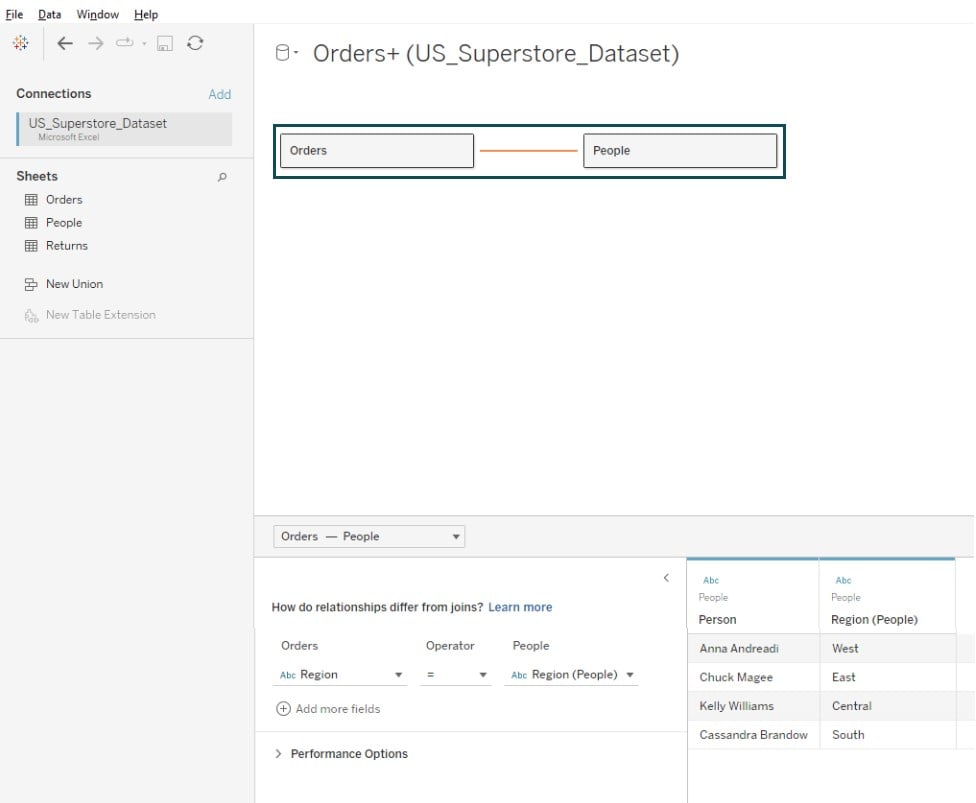
Step 4: Drop the table to the canvas. Tableau will automatically create Tableau relationships between data sources using the matching field.
In this case, Tableau used Region to create the relationship between the Orders and People tables.
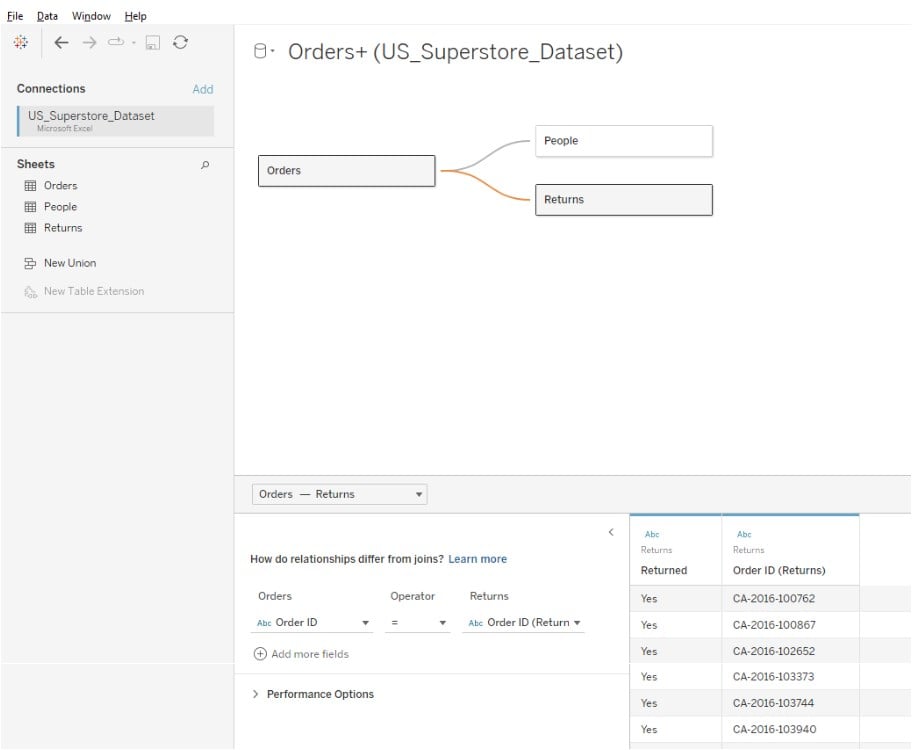
Step 5: Now drag the Returns table to the canvas. You will see the same noodle line again.

Drop the table to the canvas. As you can see, Tableau has automatically created the relationship based on the existing matching field, i.e., order id between the Orders and Returns tables.
Step 6: Expand the Performance Options to specify Cardinality, i.e., One-to-many, many-to-many or many-to-one relationships.

You can also add additional field pairs to change the fields by clicking on the Add more fields option.
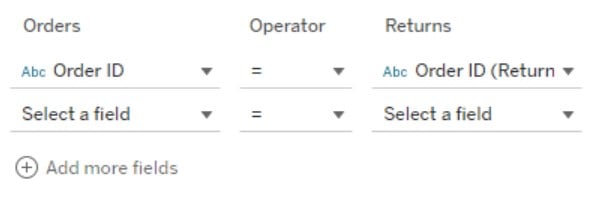
If Tableau doesn’t detect any constraints, it automatically creates many-to-many relationships and sets the referential integrity to some record matches, which is a default setting. It is similar to the full outer join condition in other database applications. It means that all the columns and rows from each of the related tables are available for your analysis and reporting.
You can expand on this to add more tables using similar steps to create additional relationships.
Note: You can’t explicitly define Tableau relationships left join for your logical tables. However, to achieve a similar result, consider specifying the cardinality and direction of the relationship between the tables.
Similarly, the linkage of Tableau relationships multiple fact tables is also supported in Tableau.
Examples
In this section, we will go through different examples demonstrating the Tableau Relationship functionality.
Example #1 – Edit a Relationship in Tableau
In this example, we will demo creating a relationship and then subsequently edit it in Tableau using the Customer_Spend Data dataset. The Customer_Spend Data dataset contains two separate files, including
- Customer_Spending – contains the customer spending details along with the date and amount of purchase
- Transaction_Category – contains the category and the nature of the spend
To create a relationship and edit it in Tableau, follow the instructions highlighted below:
Step 1: Connect with the Customer_Spend Data to the Tableau interface using the File navigator. After a successful import, you will notice two tables under Sheets..
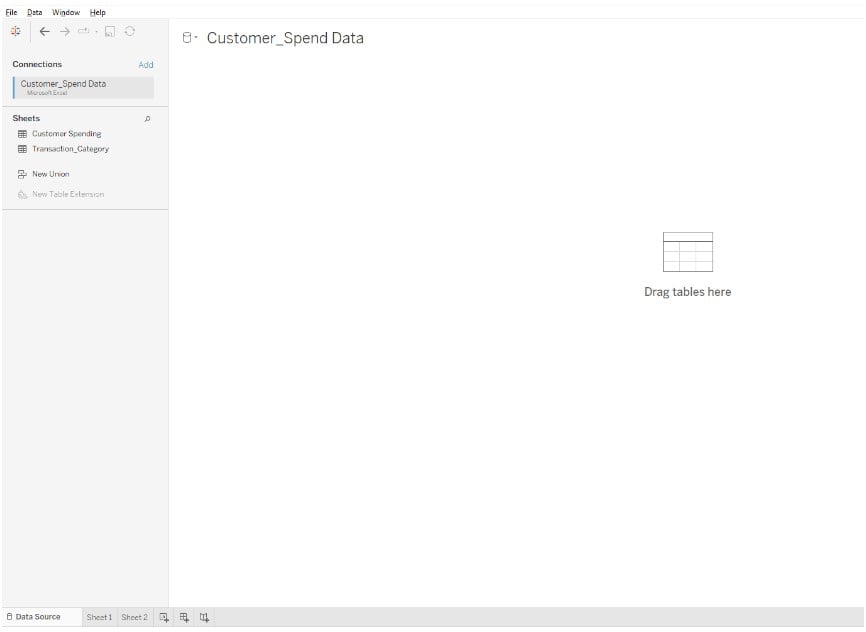
Step 2: Drag the 1st table, i.e., Customer Spending to the canvas.

Step 3: Drag the 2nd table Transaction_Category to the canvas. Tableau will add a connection line (noodle-like structure) in the canvas.
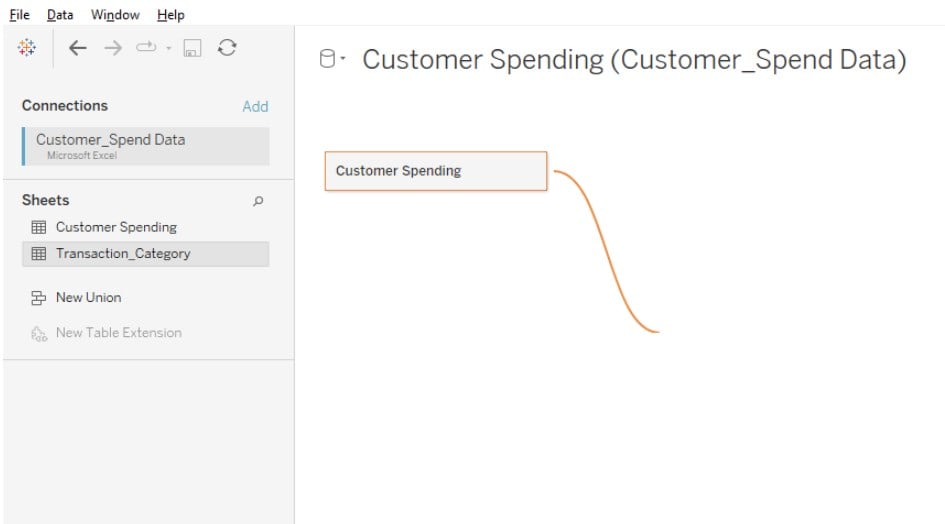
Step 4: Drop the Transaction_Category table to the view. As observed, Tableau can’t automatically create a relationship based on the fields available in both tables.

Step 5: Double-click on the connecting line between the two tables.

Step 6: Specify the field pair to create the relationship between these tables. We have chosen the Transaction Category from Customer Spending and Category from the Transaction_Category table.
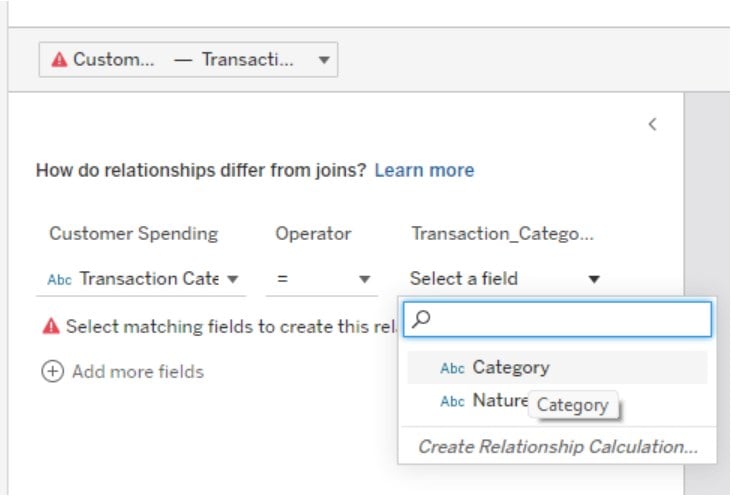
Step 7: Once you have specified the field, Tableau will now create the relationship between the tables.
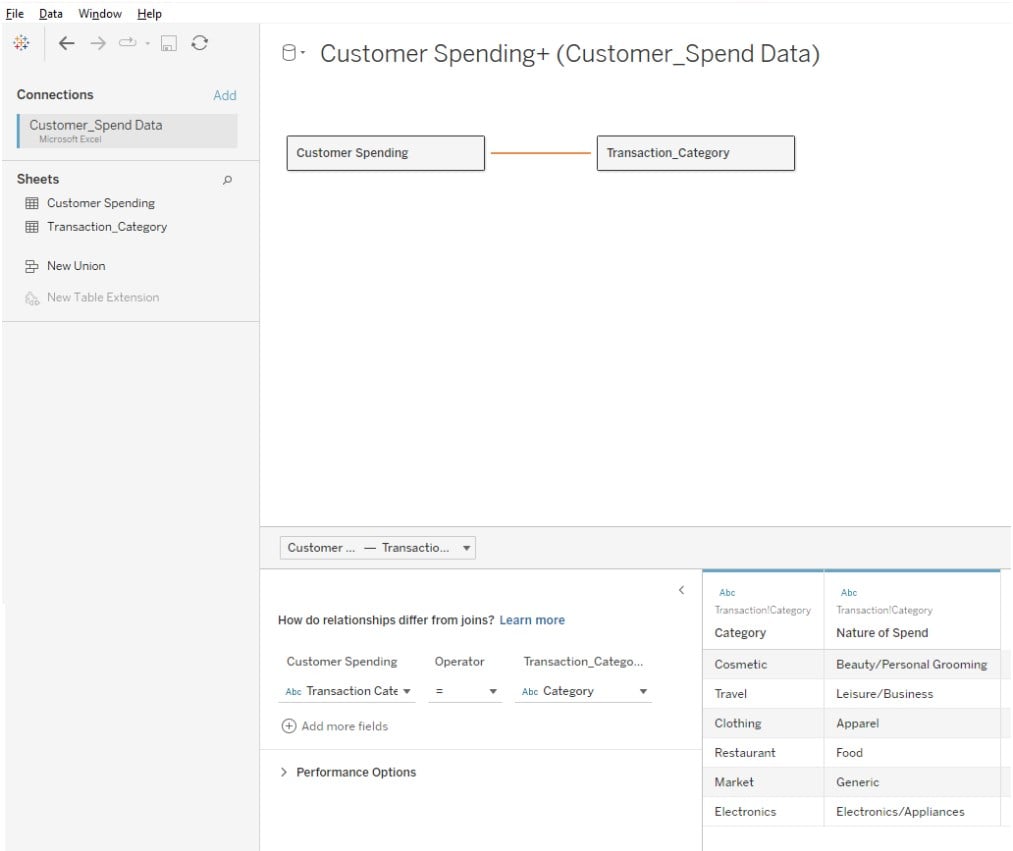
Step 8: To edit the relationship, click on the line connecting two tables and specify your changes.
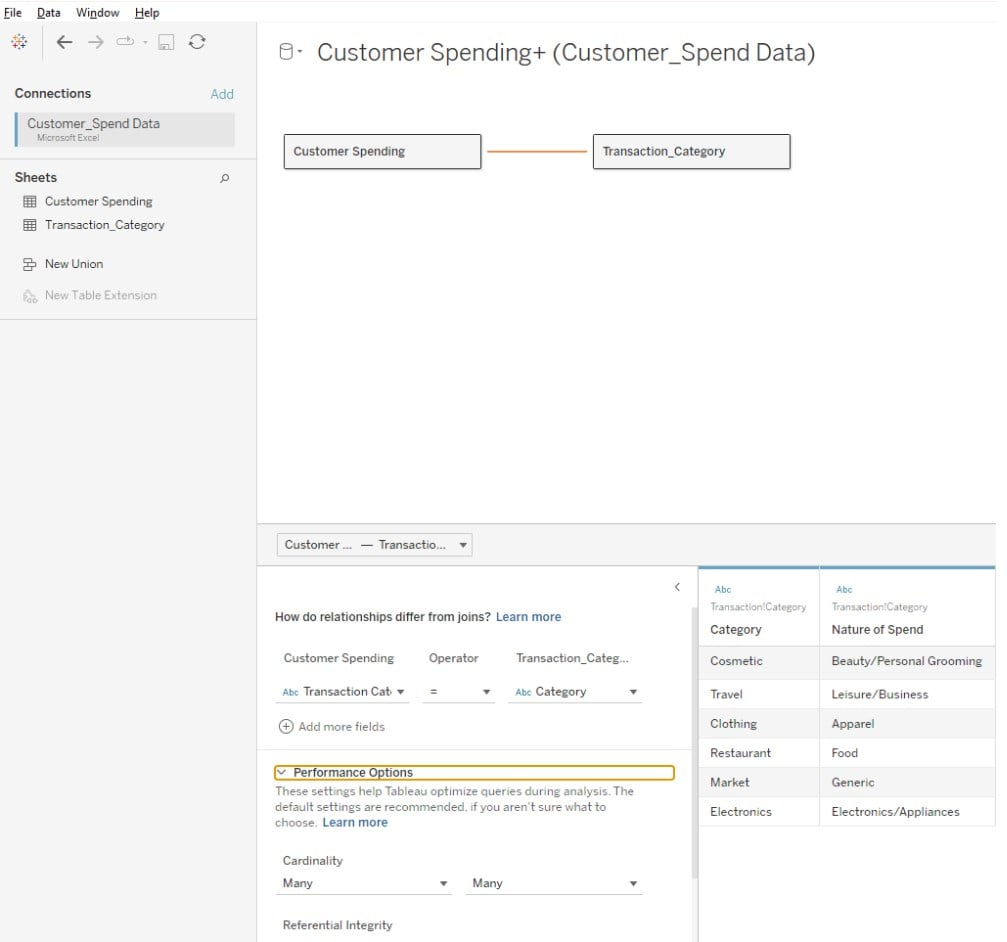
Now, you can use data fields from both the tables for analysis and visualization in Tableau.
Example #2 – View in Relationship in Tableau
In this example, we will demonstrate how to view a relationship in Tableau. For this purpose, we will refer to the same example 1, where we created and edited a relationship in Tableau.
To view a relationship in Tableau, follow the below steps:
Step 1: Navigate to the Data Source tab in Tableau.
Step 2: Hover your mouse over any relationship line (noodle/connecting line) to view the matching fields.
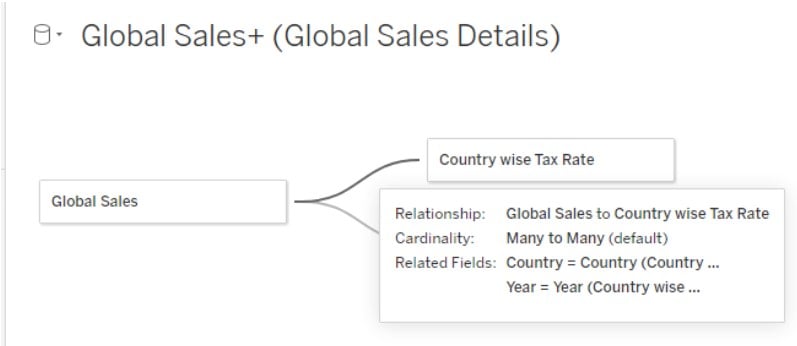
Example #3 – Linking Tables Using One-to-Many Relationships
In this example, we will link tables using one-to-many relationships using the Global Sales Details dataset. It contains 3 different underlying data.
- Global Sales – Contains the list of sales transactions across different countries along with product details
- Region – Contains the categorization of countries into different regions
- Country wise Tax Rate – Contains the tax rate applicable to different countries along with the tax year
To link tables using one-to-many relationships, you follow the steps highlighted below:
Step 1: Open the Tableau desktop and click on File – Open. Select the dataset file from your system and import it into the Tableau. Once this step is completed, you can view the tables in the Data Source tab.

Step 2: Drag the Global Sales table from Sheets to the canvas.

Step 3: Drag Country wise Tax Rate table to the canvas. As you can see, there are errors highlighted in the canvas because Tableau has failed to create the relationship based on the set of field pairs.
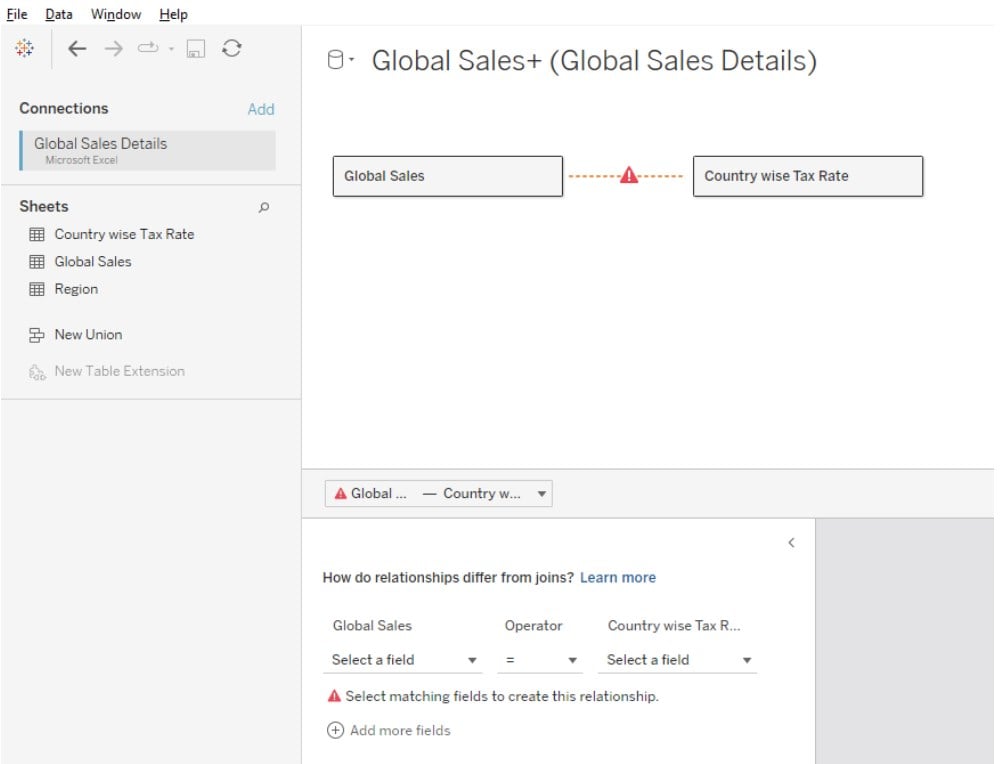
Step 4: Specify the field pairs to establish the relationship between the Global Sales and Country wise Tax Rate tables. We have used Country and Year fields to map the relationship between these tables.

Step 5: Drag the Region table to the canvas. In this case, Tableau automatically creates a relationship between Global Sales and Region tables.
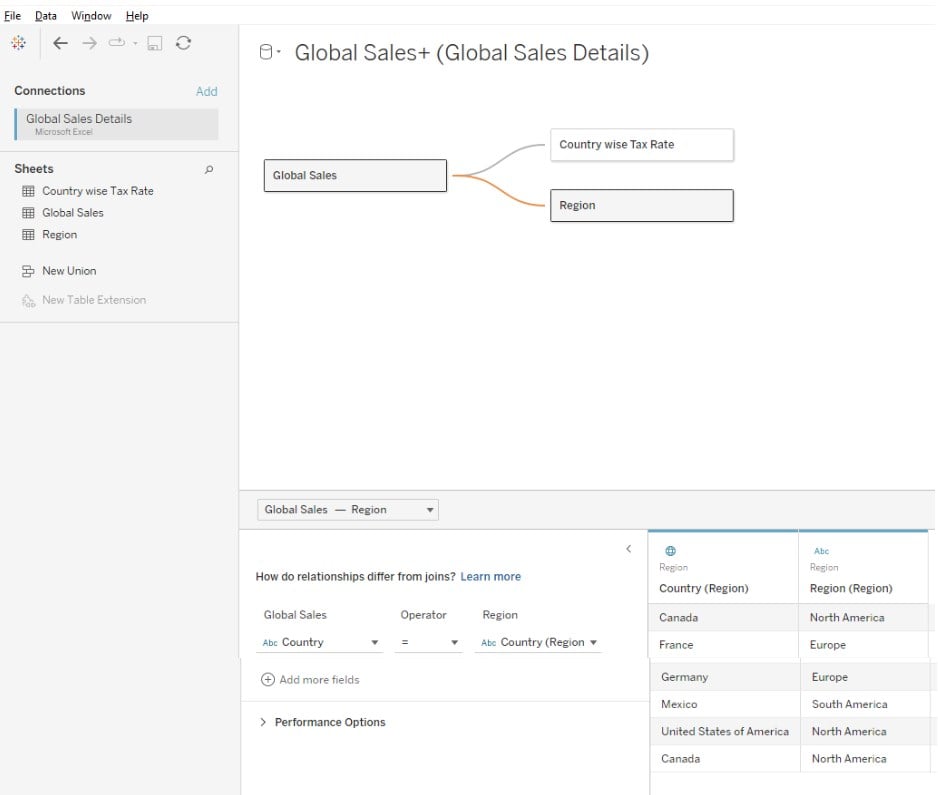
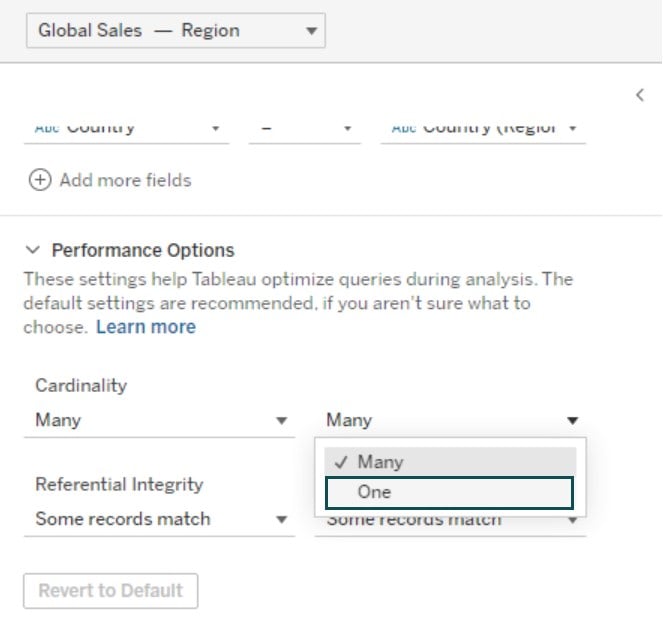
Step 6: Expand the Performance Options and change the cardinality from Many to One.
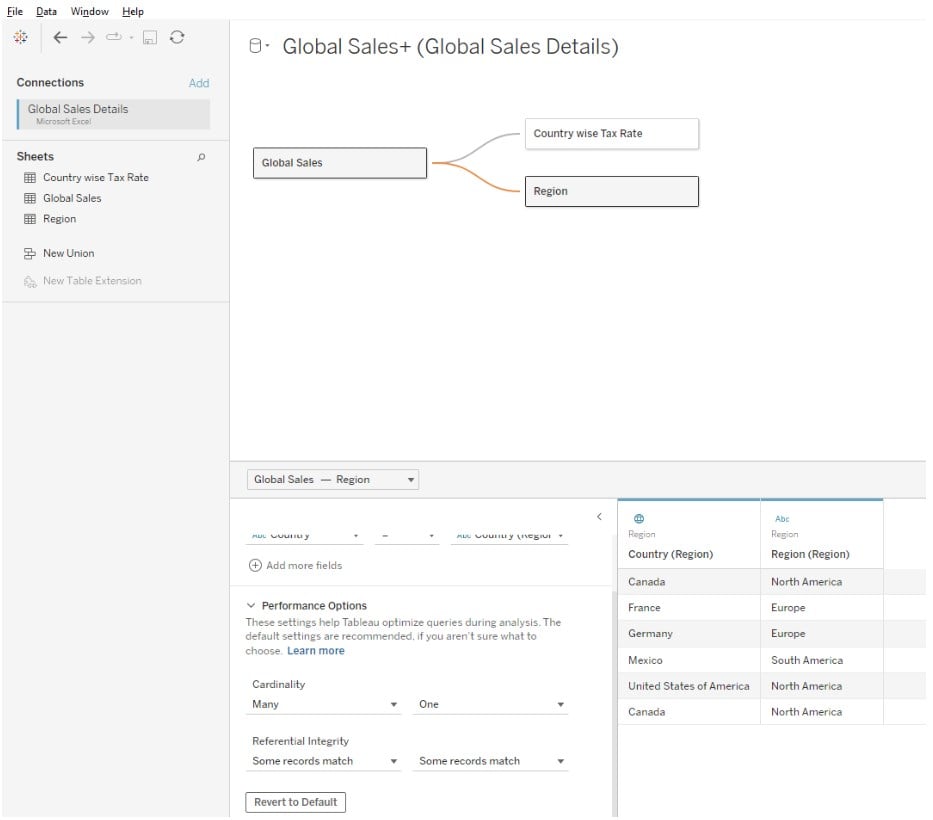
Now, Tableau has linked Global Sales and Region tables using a One-to-many relationship, while the linkage between Global Sales and Country-wise Tax Rate has a many-to-many relationship.
Step 7: Now open a new worksheet. Drag the fields from different tables to the Rows and Columns shelf to create a data visualization in the view.

Advantages and Disadvantages
The key advantages and disadvantages of Tableau relationships are:
Advantages:
- Relationships are flexible connecting lines between the logical tables and reduce the need to define any complex join types to fetch the dataset from the related tables.
- They are dynamic and automatically determine the join type based on the matching fields.
- They don’t alter or amend any changes to the underlying logical tables while applying the aggregations to the data fields. The data granularity of the related tables is maintained as is.
- Relationships don’t result in any data duplicates.
Disadvantages:
- There are certain cases where the data volume is large, and using relationships may lead to slower query performance and impact the overall system performance.
Important Things to Note
- Tableau Relationships are dependent on the matching fields between two logical tables. Ensure that the datasets from the underlying tables are properly validated and cleaned.
- Consider defining the correct relationship between the tables to view the accurate data for your analysis.
- For large datasets, there may be performance implications on the back of defined relationships. It is recommended that you carefully evaluate the impact of your relationships on the data aggregations before using relationships.
Frequently Asked Questions (FAQs)
While relationships and similar joins work, there are distinct differences between them, as highlighted below:
The key difference between blends and relationships in Tableau is in terms of the different levels of detail at which they operate.
Unions:
• Unions are useful when you want to append more data vertically to the same column structure.
• It works based on the matching columns between two tables. Hence, the columns must be similar in structure.
• Once the union is performed between two tables, the unioned physical tables are combined into a single logic table, and data is stacked one over the other.
Relationships:
• Relationships are useful when you need to combine data from different granular levels of detail.
• They use matching fields between two logical tables. You can also define multiple matching field pairs.
• Once the relationship is defined, Tableau automatically applies the right aggregations and joins based on related fields.
Whether Tableau relationships are case-sensitive or not, depends on the underlying data source. For example, if you are using Microsoft Excel, then it is case insensitive. However, for data sources such as Text or CSV files, they are case-sensitive.
Download Template
This article must be helpful to understand the Tableau Relationships, with its formula and examples. You can download the template here to use it instantly.
Recommended Articles
This has been a guide to Tableau Relationships. Here we learn how to create & edit relationships in tableau with examples, features, pros, cons and points to remember. You can learn more from the following articles –

Leave a Reply