What is Tableau Window_Sum?
The WINDOW_SUM function is used to find the sum of a particular feature over a specific range. It returns the sum of an expression within a ‘window.’ This function is handy for creating running totals, cumulative sums, or other types of aggregate calculations over a window of data points. All statistical functions, such as SUM, MIN, MAX, COUNT, and so on, are available in the WINDOW version, as seen below.
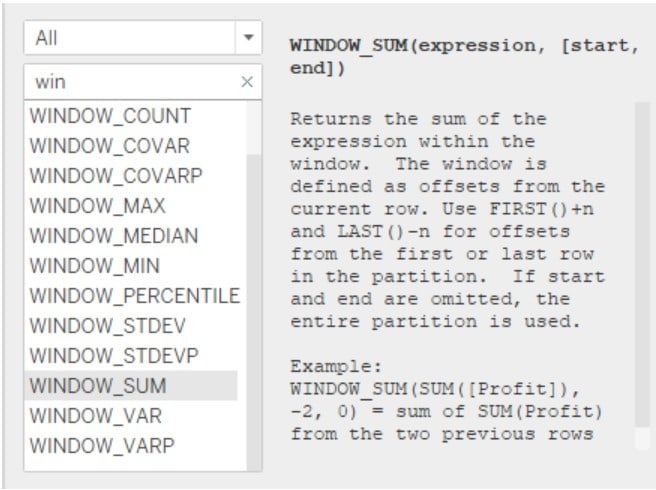
Here is an example depicting the WINDOW_SUM calculation in Tableau. Here, the sum of the entire table (down) is calculated.
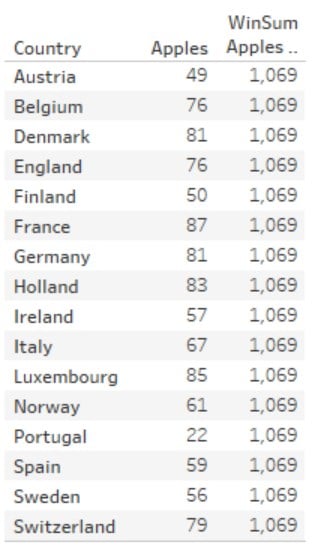
If you drag the entire column and look at its summary, you’ll be able to understand how the WINDOW_SUM works.
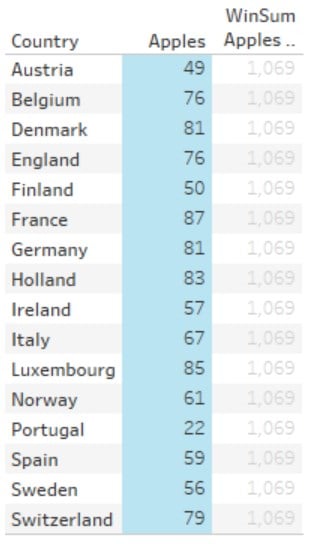
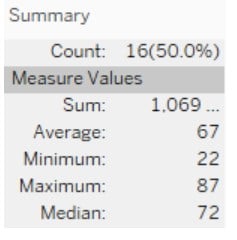
The Summary in Tableau acts as a calculator with which you’ll be able to understand where the value 1069 comes from.
Table of contents
Key Takeaways
- WINDOW_SUM calculates the sum of an expression across a specified range of rows within a window, useful for cumulative calculations.
- It aggregates data over a dynamic range, allowing for calculations like running totals, moving sums, and period-over-period comparisons.
- WINDOW_SUM(expression, [start, end]), where expression is the measure to aggregate, and start and end define the window range.
- The results depend on how data is partitioned and addressed in the view, making configuration crucial for accurate outcomes.
- Proper handling of null values and understanding the impact of filters and sorting on the results is necessary.
Syntax
Below is the syntax for the WINDOW_SUM calculation in Tableau.
WINDOW_SUM(expression, [start, end])
where,
- expression is the measure or calculation you want to aggregate.
- start (optional): The starting point of the window relative to the current row. If not specified, the default is the first row in the partition.
- end (optional): The ending point of the window relative to the current row. If not specified, the default is the last row in the partition.
How to use WINDOW_SUM in Tableau?
Follow these simple steps to use the WINDOW_SUM in Tableau.
Step 1: To start with the process, open a New workbook by clicking on “File”- ”New.” It is present in the title bar of the application.

Step 2: Select the dataset that you want to work with. There are two ways to do so. One is to simply drag and drop the dataset file into the workbook.
The other way is to click on “New Data Source” or press Ctrl+D and select the file type of your choice. It will open the Files application, where you can select the File of your choice.
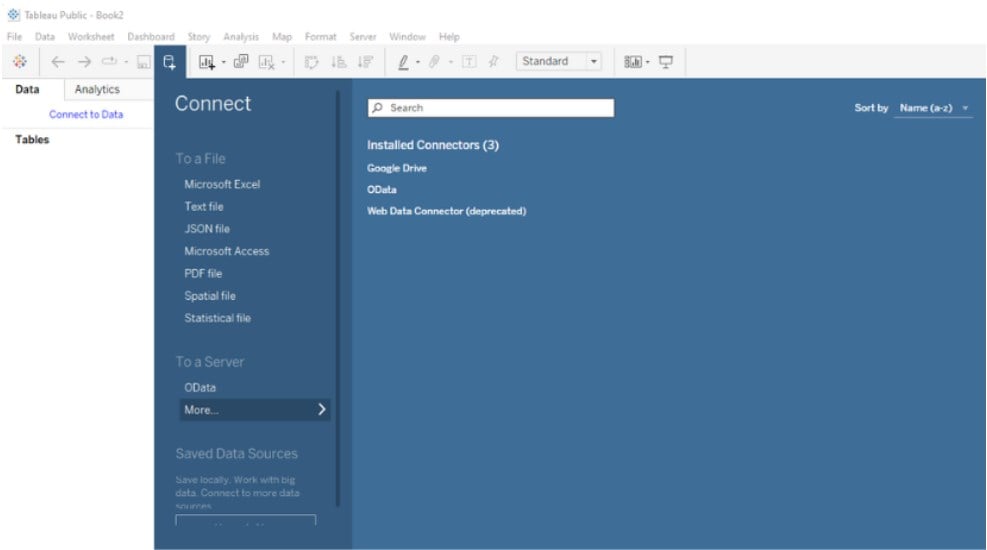

For this example, the Airbnb dataset of Austin, Texas, is used.
Step 3: Click on “Sheet1” highlighted in orange.


Step 4: Drag and drop the feature “Host Since” in the Columns tab. It will default to the YEAR value.

Step 5: Place “Property Type” in the “Rows” section.

Step 6: Drag and drop “Availability 30” to the table.

Step 7: Create a calculated field to call the WINDOW_SUM calculation.

Step 8: Call the Tableau WINDOW_SUM of the “Availability 30” feature, which is also aggregated with the SUM function.

Step 9: Apply the changes and drag and drop the calculated field to the table, like Step 6.
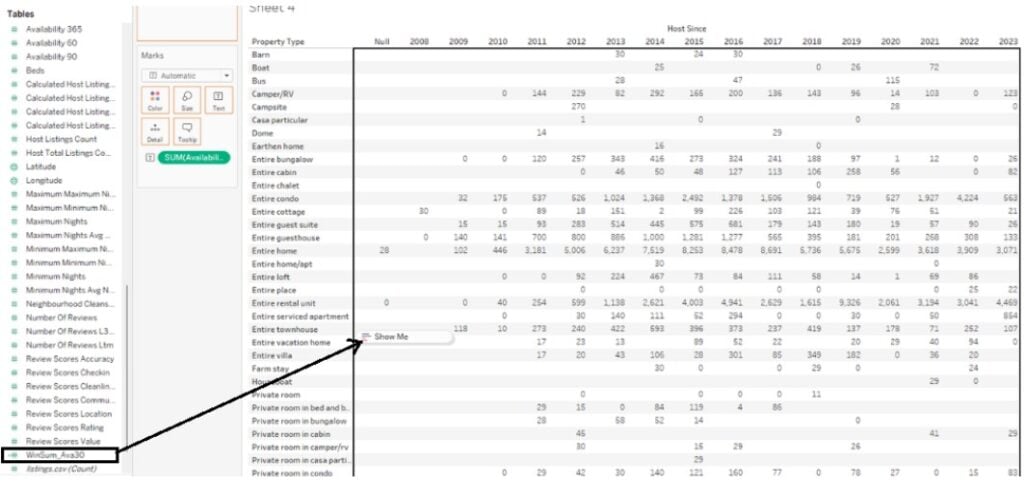
Step 10: Click on “Worksheet” in the Toolbar and select “Show Summary.”

Step 11: Drag and select all the values on the top row. If you see the summary, they are equal to the bottom row.


It is the final table.

Examples
Follow these steps to make sure that the WINDOW_SUM fixed Tableau functions to a specific range in different ways. You can also see the different range of variations that are possible.
Example #1
When you want to find the sum of the previous and current rows, the WINDOW_SUM function can be used in Tableau. By manipulating the [start] and [end] values, it is possible to create such a calculation. Learn how to do these by following these steps in a new Tableau workbook.
Step 1: Drag and drop the food consumption database in Europe.

Step 2: Place the Country in the “Rows” section.

Step 3: Drag and drop “Biscuits” and “Frozen Veggies” to the table. By dragging and dropping these, these features are represented under “Measure Names.”

Step 4: Create a “Calculated Field” to implement the running total field calculation.

Step 5: Write the code below and change the name of the field to your preferred choice.

By specifying the sum as ‘-1’, it means to start from the previous value (except the first value), and ‘0’ means the current value. It means that any added values will be cumulatively added due to the nature of the Tableau WINDOW_SUM function.
Step 6: After creating the “Calculated Field”, drag and drop “winsum_food” into the table as shown.

Step 7: By dragging the first two values, you can find their sum.

As you can see, the sum of the previous and current values creates a running total.

Example #2
In this example, you need not only declare the WINDOW_FUNCTION but also drastically change its computing style by changing the way it calculates across this table. This will be explained in detail in the following example.
Step 1: In a new workbook, drag and drop the Airbnb dataset of Austin, Texas.

Step 2: Drag and drop the “First Review” and the “Host Identity Verified” features in the “Rows” section.

Step 3: Drag and drop the “Beds” feature in the “Text” component in the “Marks” tab.

Step 4: After that, create a calculated field to add a range from the previous value to the next value of the table [-1,1] range.

Step 5: Simulate the WINDOW_SUM of the “Beds” function and set the start range as -1 and the end range as 1.

Here, -1 is the previous table value concerning the current value, and 1 is the value after the current table value. The SUM of Beds aggregate is also taken in this case.
Step 6: After creating the Calculated Field “Win_sum_Beds,” drag and drop it in the table, as shown.

Currently, this is how the WINDOW_SUM is calculated.

As you can see, 3,1 and 7 are added to create 11, where 3 is the previous value, and 7 is the following table value.
Step 7: Right-click on “Win_sum_beds” and click on “Compute Using,” then change to “First Review.”

The table changes dramatically after this – even the way the previous values are taken changes completely.

Since the table calculates the WINDOW_SUM based on a value from the “First Review” function, the value places change quite drastically as opposed to before. This is how you can implement changes into Tableau WINDOW_SUM’s working.
Example #3
In this example, you will learn how to create a running total or cumulative sum of a feature by adding all the values as they go. Again, this is a very simple process of manipulating the start and end value components in Tableau using the Tableau WINDOW_SUM syntax.
Step 1: Open a new workbook by going to “File” – “New” and dragging and dropping the Airbnb dataset of Austin, Texas.

Step 2: Drag and drop the “Last Review” and “Price” in the “Rows” section.

Step 3: Exclude all the NULL values in the table by clicking on them and selecting “Exclude.” It will remove all NULL values from your table.

Step 4: Drag and drop “Maximum Nights” in the table when the “Show Me” icon is displayed, as shown.

Step 5: Create a calculated field to create a cumulative sum function.

Step 6: Start the cumulative sum function by calling the Tableau WINDOW_SUM of the “Maximum Nights” feature with
[start] as the FIRST() function in Tableau and
[end] as 0 (current position in the table)

In the context of Tableau WINDOW_SUM, using FIRST() as the start point means the calculation will start from the first row of the partition. In this manner, the sum is calculated from the first row to the last row cumulatively.
Step 7: Drag and drop the cumulative sum field into the table as shown.

Step 8: Drag the values in the table to see how the sum is calculated. As you can see, the sum is calculated from the first row to the subsequent rows, and their sums are written in the adjacent column.

It is the final table.

Important Things To Note
- Use Tableau WINDOW_SUM to create running totals or cumulative sums in your data visualizations.
- Leverage the function for dynamic range calculations by adjusting the start and end points.
- Understand and properly configure partitioning and addressing when using WINDOW_SUM.
- Combine Tableau WINDOW_SUM with other table calculation functions for advanced analyses.
- Refrain from using it without understanding its impact on the entire dataset.
- Understand the performance implications of using WINDOW_SUM on large datasets.
Frequently Asked Questions (FAQs)
Yes, Tableau WINDOW_SUM can be customized to include only certain rows or data points by specifying the start and end parameters. Use filters to limit data before applying WINDOW_SUM. Adjust partitioning and addressing to control which rows are included in the calculation.
Yes, WINDOW_SUM is affected by filters and other Tableau operations. Filters can change the data included in the calculation. Partitioning and addressing settings also influence the results.
Yes, Tableau WINDOW_SUM can be used in combination with other Tableau functions. It pairs well with functions like LOOKUP, INDEX, RANK, FIRST(), and LAST() for advanced calculations.
Yes, alternatives to WINDOW_SUM for calculating running sums in Tableau include the RUNNING_SUM function. You can also use table calculations like TOTAL for certain cumulative aggregations.

Download Template
This article must help understand WINDOW_SUM in Tableau with its formulas and examples. You can download the template here to use it instantly.
Recommended Articles
Guide to What is the TABLEAU WINDOW_SUM. We explain how to use window sum in Tableau with syntax, examples, and points to remember. You can learn more from the following articles –

Leave a Reply