
What Is Z Test In Excel?
Z Test in Excel helps perform hypothesis testing to assess if a finding is statistically significant. And Excel offers an inbuilt Statistical function, Z.TEST(), which determines the one-tailed P-value of a Z-test.
Users can utilize Z.TEST() in scenarios such as testing if a stock’s average daily return exceeds a certain percentage.
Use this Z Test In Excel Template to follow along with the examples in this article.
Download Excel TemplateFor example, the below table shows a student’s test scores.

Suppose the hypothesized mean for the above sample is 41. And we have to determine the one-tailed probability of a Z-test that the hypothesized sample mean exceeds the observed average of the above array. Assume the target cell is D1.
Then, using the Z.TEST() in the target cell will fetch us the P value for Z Test in Excel.

The Z.TEST() accepts the given array of test scores and the hypothesized sample mean of 41 as the input arguments. And it returns the P value for Z Test in Excel as 0.733208.
As the Z.TEST() return value of 0.733208 is more than 0.5, it implies that the hypothesized sample mean exceeds the observed average of the above array of test scores.
Key Takeaways
- We can perform Z Test in Excel using the inbuilt function Z.TEST, which helps determine the one-tailed P-value in a Z-test. And a P-value of more than 0.5 indicates the probability of the hypothesized population mean exceeding the observed average of the supplied array is high.
- Users can utilize the Z.TEST function to check if an entity exceeds a certain value or performance level.
- The Z.TEST function accepts two mandatory arguments, array, and x, and one optional argument, sigma, as input.
- The Z-test is also possible using the Data Analysis ToolPak feature.
Z Test() Excel Formula
The syntax of the function for Z Test in Excel is:

where,
- array: The data array against which we must test the hypothesized population mean (x).
- x: The hypothesized population mean to test.
- sigma: The known population standard deviation.
While the first and second arguments in the above function are mandatory, the third is optional. And if we ignore it, the Z.TEST() uses the sample standard deviation.
Furthermore, when using the Z.TEST(), the data points should be independent.
How To Perform Z Test In Excel?
We can use the function for the Z Test in Excel, Z.TEST(), in 2 ways, namely,
- Access from the Excel ribbon.
- Enter in the worksheet manually.
Method #1 – Access From The Excel Ribbon
Select a target cell for output → select the Formulas tab → click the More Functions option drop-down → click the Statistical option right arrow → select the Z.TEST function, as shown below.

The Function Arguments window appears. Enter the arguments in the Array and X mandatory fields and the Sigma field if required → click OK.

Method #2 – Enter In The Worksheet Manually
- Choose a target cell for the output.
- Type =Z.TEST( in the cell. [Alternatively, type =Z and double-click the Z.TEST function from the Excel suggestions.]
- Enter the arguments as cell values or references and close the brackets.
- Press Enter to execute and get the required P-value.
The first table contains a sample of temperatures in Texas.

Suppose the hypothesized population mean value is 35°F. And we must determine the probability of the hypothesized population mean value exceeding the average of the array of temperature values. Assume the target cell is D2.
Then, here is how to use the Z.TEST function in the target cell to determine the required one-tailed probability.
- Select the target cell D2 and enter the Z.TEST().
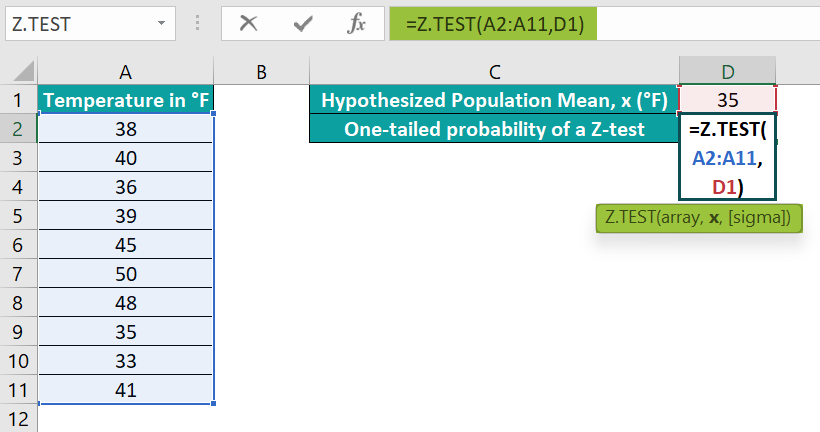
- Press Enter to obtain the required P-value of the Z-test.
[Alternatively, select the target cell D2 and click Formulas → More Functions → Statistical → Z.TEST to apply the function in the chosen cell.
The Function Arguments window will open, where we must update the mandatory argument fields.
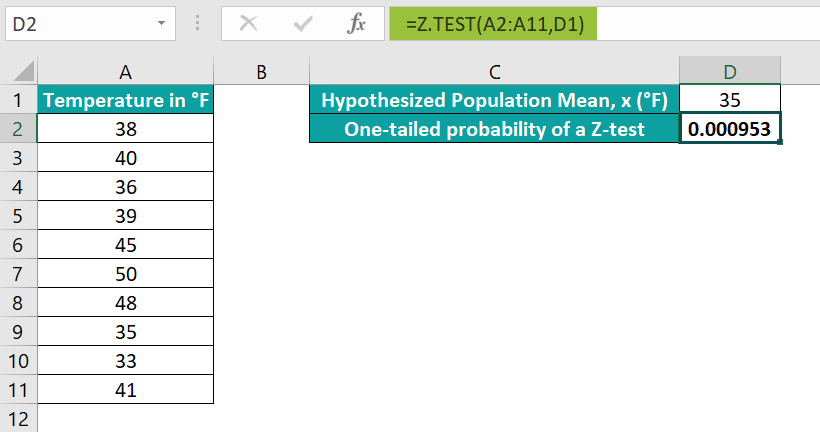
Clicking OK will close the window. And we will obtain the Z.TEST() output as 0.000953.]
The Z.TEST() output is less than 0.5. It implies that the probability of the hypothesized population mean value of 35°F exceeding the average of the given array of temperature values is low.
Examples
Example #1
The following example explains one sample Z Test in Excel.
The first table shows a stock’s daily return rates.

And the second table contains the normally distributed population’s hypothesized mean and known standard deviation.
Suppose the requirement is to determine the one-tailed probability of the Z-test that the population’s hypothesized mean exceeds the observed stock’s average daily return. Assume the target cell is E4.
Then, performing one sample Z Test in Excel cell C4 using the Z.TEST() will help achieve the required one-tailed P-value.
- Step 1: Select the target cell E4, enter the Z.TEST(), and press Enter.
=Z.TEST(A2:A11,E2,E3)

The one-tailed P-value is 0.85408. It implies that the probability of the hypothesized population mean value exceeding the observed average daily return of the stock is high. And thus, the average daily return of the stock is below 4%.
Example #2
Consider a population of patients with a normally distributed stress level and a mean value of 18.
Suppose we must determine if a therapy affects stress levels. So, we consider 15 patients to record their stress levels after monitoring them over a fixed period.

We can perform a two-tailed Z-test in the second table to evaluate if the therapy has a notable positive or negative effect on the patient’s stress levels. The reason for performing a two-tailed test is that the hypothesis is not whether the therapy reduces stress levels.
So, the null hypothesis is that therapy does not affect the patients’ stress levels.
- Step 1: Select cell D3, enter the below Z.TEST(), and press Enter.
=Z.TEST(A2:A16,D2)

- Step 2: Select cell D4, enter the formula to determine the two-tailed P-value of the Z test, and press Enter.
=2*MIN(Z.TEST(A2:A16,D2),1-Z.TEST(A2:A16,D2))

The two-tailed p-value of 0.034 is less than the significance threshold of 0.05. So, we can reject the null hypothesis. And thus, the Z-test result interpretation is that the therapy significantly affects the patients’ stress levels.
Further, the one-tailed p-value suggests that the chances of the hypothesized population mean value of 18 being more than the average stress level of the sample are low.
Example #3
Let us see an illustration for two sample Z Test in Excel.
We can opt for this method when the supplied sample size equals or exceeds 30.
The following table shows the normally distributed data of the per day count of deaths in two cities.
Suppose the requirement is to determine whether the mean of the number of per day deaths for the two cities are different. And for that, we pick a random sample of 20 days of data for each city and record the number of deaths.

It is a scenario of two sample Z Test in Excel, and we can perform the test using the Data Analysis ToolPak feature in the Data tab.
The Data Analysis ToolPak feature includes a Z-test in Excel two sample for means option to conduct the required test.
But first, check the Data tab for the option Data Analysis. If we do not find the feature, follow the below steps to install it.
- Step 1: Click File → Options.


- Step 2: Choose Add-ins from the left menu.

- Step 3: Click on the inactive Analysis ToolPak add-in and click Go.

- Step 4: Select the Analysis ToolPak box and click OK.

We can now view the Data Analysis option in the Data tab
- Step 5: Select cell E1, enter the VAR.P() to determine the variance of the City_ABC dataset, and press Enter.
=VAR.P(A2:A21)

Next, select cell E2, enter the VAR.P() to determine the variance of the City_XYZ dataset, and press Enter.
=VAR.P(B2:B21)

- Step 6: Click Data → Data Analysis.

- Step 7: In the Data Analysis window, click the Z-test in Excel two sample for means option. And click OK.

The above step opens the 2 sample Z-test window.
- Step 8: In the 2 sample Z-test window, update the fields as depicted below.

The two fields under Input are the data arrays of daily deaths in the two cities. And let the hypothesized mean difference be 0.
Next, we must enter the variances for the two input arrays, calculated in step 5. And then, check the Labels box as we require the column headings in the Z-test output, and Alpha should be 0.05, the significance threshold value.
Further, set the above Output options to view the two sample Z-test result in the active worksheet.
- Step 9: Click OK to obtain the below output.

The test statistic is -4.55963, and the pertaining P-value is 5.12415E-06. As the P-value is less than 0.05, the significance threshold, we can reject the null hypothesis.
Also, if the condition z < -z Critical two-tail or z > z Critical two-tail holds, we can reject the null hypothesis.
In this case, the z value of -4.55963 is less than the -z Critical two-tail value, -1.959963. So, one of the conditions to reject the null hypothesis holds.
And thus, the conclusion is that the mean value of the count of per day deaths is considerably different between the two cities.
Important Things To Note
- For a non-numeric x or sigma, the function for Z Test in Excel, Z.TEST(), returns the #VALUE! error.
- For a zero sigma, the Z.TEST function throws the #NUM! error.
- Suppose the supplied array is empty. Then, the Z.TEST function output will be the #N/A error.
- Suppose the specified array range contains only one value. Or, you omit sigma, and the supplied array’s standard deviation is zero. Then, the Z.TEST function throws the #DIV/0! error.
Frequently Asked Questions (FAQs)
The Z.TEST function calculates the one-tailed P-value in the following ways:
The Z.TEST() uses the below formula when we supply the sigma value.
Z.TEST(array,x,sigma) = 1 – Norm.S.Dist((Average(array)-x) / (sigma/√n),TRUE)
And when we do not specify the sigma value, the function calculates using the below formula.
Z.TEST(array,x) = 1 – Norm.S.Dist((Average(array)-x) / (STDEV(array)/√n),TRUE)
The term n in the above expressions is the array size (COUNT(array)).
We can use Z Test in Excel when the sample size equals or exceed 30, and the sample data is one or two.
We can apply the Z.TEST function in Excel VBA using the below method:
Application.WorksheetFunction.Z_test(Arg1,Arg2,Arg3)
The arguments in the above method have the same definition as the Z.TEST() arguments explained in the Z Test() Excel Formula section of the above article.
Here is an example that shows how to use the above method.
The first table contains a data set.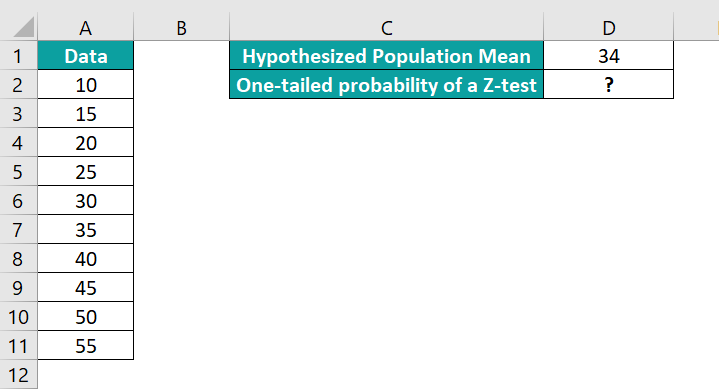
Suppose the hypothesized population mean for the above normally distributed data is 34. Then, here is how to obtain the one-tailed probability of a Z-test in cell D2 using the Excel VBA method for Z.TEST().
• Step 1: Keep the active worksheet containing the above data open and access the VBA Editor using Alt + F11.
• Step 2: Choose the required VBAProject and click on Module under the Insert tab.
A new Module window opens.
• Step 3: Enter the VBA code to apply the Z.TEST() in the target cell.
Sub Z_test()
Dim ws As Worksheet
Set ws = Worksheets(“Z-test_FAQ”)
ws.Range(“D2”) = Application.WorksheetFunction.Z_test(ws.Range(“A2:A11”), ws.Range(“D1”))
End Sub

• Step 4: Click the Run Sub/UserForm icon to execute the VBA code.
We can now open the active sheet and view the required one-tailed P-value of the Z-test in cell D2.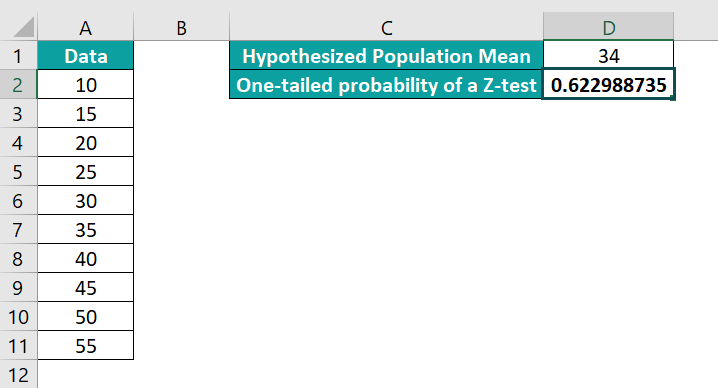
The P-value of 0.622988 is more than 0.5. And thus, the probability of the hypothesized population mean value exceeding the observed average of the given array is high.
Use this Z Test In Excel Template to follow along with the examples in this article.
Download Excel TemplateRecommended Articles
Continue with these related resources when you want the next practical step in this topic.
- Statistics In Excel
- Descriptive Statistics in Excel
- Standard Deviation In Excel
- MEDIAN Excel Function
- MODE Excel Function
Explore the full Excel Statistical Functions guide or browse Excel Resources.