
What is AVEDEV in Google Sheets?
AVEDEV in Google Sheets is used to find the average of the absolute deviations from the mean of data points. In other words, it is used to calculate by how much the values in a dataset spread out from the average value. The AVEDEV function does not square the differences like in standard deviation; hence, it is less sensitive to extreme values. This helps us understand the consistency or variability within a dataset of numbers.
For example, suppose we have the score of a student in 5 subjects for in cells A2:A6 To find the average deviation from the mean, let us use the following formula =AVEDEV(A2:A6) to find the average deviation from the mean. The mean of these numbers is 82, and the average of their absolute deviations is 9.4. This means that, on an average, each value differs from the mean by 9.4 units. The AVEDEV function is used in data analysis to find the variability in performance or measurements.
Use this AVEDEV in Google Sheets Template to follow along with the examples in this article.
Download Excel TemplateKey Takeaways
- AVEDEVin Google Sheets is a function that calculates the average of the absolute deviations of data points from their mean.
- It is very useful for measuring the consistency or variability of a dataset, such as sales, production output, or performance metrics.
- The function requires numeric values in the selected range; any text or empty cells are ignored.
- AVEDEV always returns a positive number representing the average deviation from the mean, providing a straightforward way to assess how spread out the values are without being overly sensitive to extreme outliers.
Syntax
As seen above, we use AVEDEV to calculate the average of the absolute deviations of data points from their mean value. The AVEDEV Google Sheets formula is as follows:
=AVEDEV(value1, [value2, …])
The arguments are as follows:
- value1: The first range or array of numbers
- value2, …: (Optional) Additional ranges or values to include in the calculation.
Interpretation of results:
The result is always a positive number that represents the average deviation from the mean. A smaller AVEDEV shows that the data points are closer to the mean with less variation. Similarly, a larger AVEDEV value indicates greater spread or variability in the dataset.
How To Use AVEDEV Function in Google Sheets?
AVEDEV in Google Sheets helps measure how much the values in a dataset vary from the mean value, thereby helping us find the degree of variability in the data. This function is especially useful for statistical analysis, quality control, and performance evaluation. The AVEDEV function can be used either manually or from the Google Sheets menu.
Entering AVEDEV Manually
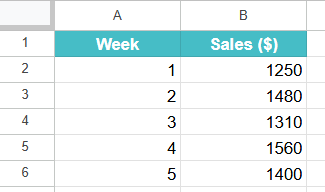
Let us look at a simple example to calculate the average deviation of a set of sales figures.
Step 1: Enter the values in a Google Sheet, as shown below.
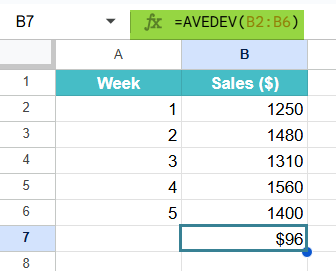
Step 2: Go to a cell B7 and type the following:
=AVEDEV(

Step 3: Enter the cell range that contains your data to find the deviation of the sales from the mean
=AVEDEV(B2:B6)

and close the parentheses.
Step 4: Press Enter. You will get the average of the absolute deviations from the mean. In this example, the result will be 60.8, meaning the values differ from the mean by an average of 60.8 units.

Using AVEDEV From the Google Sheets Menu
- Select the cell where you want the result to appear.
- Click on the Insert menu. From here, go to Function → Statistical.
- Choose AVEDEV from the list of functions and select the range of cells containing your data.
- Press Enter to get the average deviation of the values from their mean.
This simple process allows you to quickly measure the consistency or variability of your data in Google Sheets.
Examples
Experts use AVEDEV in data analysis when they want to find by how much the values in a dataset vary from the average. It is very useful in business analytics, performance tracking, and quality control to measure the values for consistency. Let us look at some examples showcasing the same.
Example #1
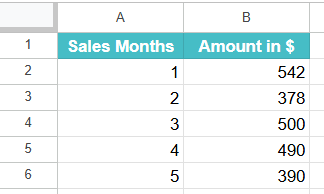
We have an example of a store whose owner wants to analyze how consistent their daily sales are over five days. The sales figures are all entered in an empty sheet. The owner wants to know by how much, on average, each day’s sales deviated from the mean.
Step 1: Enter the required data in the sheet, as shown below.
Step 2: Click on a blank cell and enter the AVEDEV formula as follows:
=AVEDEV(B2:B6)

Step 3: Press Enter. The result will be 96, which means that, on average, the daily sales differed from the mean by 96$.
This helps the store owner find the variation in sales performance and determine whether their sales pattern is stable or largely fluctuating.
Example #2 – Assess How Consistent Sales FIgures are Over Time.
IN an organization, a sales manager wants to evaluate how consistent monthly sales have been for a newly introduced product line over six months. His goal is to understand whether the team’s performance is stable or if there are significant variations that need attention.
Step 1: Enter the following data into your Google Sheet.
Step 2: Now, go to the cell where you want the result and enter the AVEDEV formula:
=AVEDEV(B2:B7)

Step 3: Press Enter. The result is approximately 1,216, indicating that, on an average, each month’s sales differ from the mean by around $1,216.
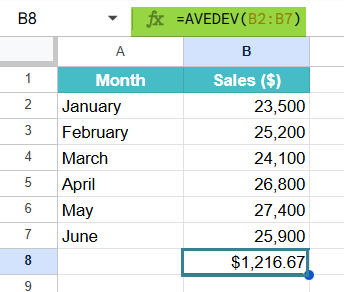
This helps the sales manager assess the stability of sales over time. A moderate deviation like this indicates consistent sales to a certain extent, with only slight fluctuations. This shows steady demand and effective sales performance throughout the six-month period.
Example #3 – Using AVEDEV with AVERAGE Function
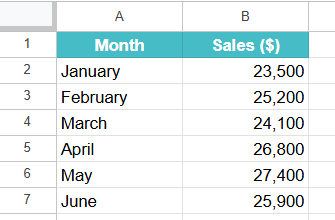
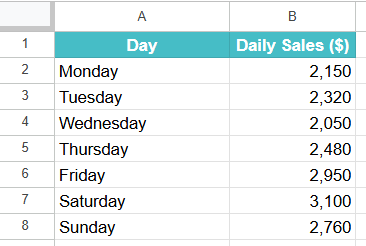
Let us consider the example of a restaurant owner wanting to understand not just how consistent their daily revenue is, but also how it compares to their average daily target. They track the total sales over seven days to see how much the actual sales deviate from the average.
Step 1: Enter the following data in a Google Sheet.
Step 2: To calculate the average daily sales, click on a blank cell and enter:
=AVERAGE(B2:B8)
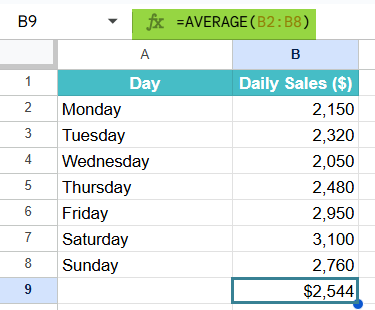
Press Enter. The result will be approximately 2,544, showing the mean daily revenue.
Step 3: Now, to calculate how much each day’s sales deviate (on average) from this mean, click on another blank cell and enter:
=AVEDEV(B2:B8)
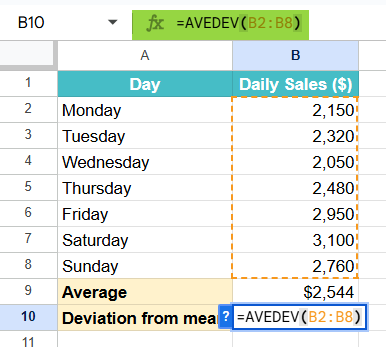
Step 4: Press Enter. The result will be approximately 336, meaning that on average, each day’s sales differ from the mean by about $336.

This gives the restaurant owner valuable insights into the average daily revenue and how consistent sales are throughout the week. He can take decisions based on this data. For instance, if weekends values are significantly higher, the owner can plan weekday promotions or special menus to balance sales.
Important Things to Note
- Always check the data points to see if they are all numeric values.
- Text or empty cells within the range are ignored, but invalid entries can cause errors or inaccurate results.
- If the dataset includes a large range of values, consider using consistent units for more meaningful results.
- AVEDEV returns a positive value always because it measures the magnitude of deviation, not direction.
- One can combine AVEDEV with other functions like AVERAGE or STDEV to compare different measures of data variation during data analysis.
Frequently Asked Questions (FAQs)
Some of the common errors when using AVEDEV include:
1. #DIV/0! Error – It occurs when no numeric values are provided in the range, and if there is nothing to calculate.
2. #VALUE! error – We get this error when any of the cells referenced contain text or invalid entries which are not interpreted as numbers.
3. Incorrect range selection – If headers or labels of text are included within the selected range, the function may return unexpected results.
To avoid these errors, ensure that the selected range only contains valid numeric data.
We use AVEDEV in Google Sheets when we must measure how consistent a dataset is by calculating the average deviation of each value from the mean value.
The value is useful in business analysis, such as checking sales consistency across months, evaluating employee performance stability, or monitoring production quality.
The difference from STDEV is that while STDEV gives more weightage to large deviations, AVEDEV gives a simple average of deviations. It is easy to interpret in practical situations.
The AVEDEV function calculates the average of the absolute deviations from the mean, while STDEV calculates the standard deviation. Thus, STDEV is more sensitive to outliers, while AVEDEV gives a more balanced measure of variability.
One can use AVEDEV when they wish to understand overall consistency in the data, while STDEV can measure statistical dispersion or volatility precisely.
Use this AVEDEV in Google Sheets Template to follow along with the examples in this article.
Download Excel Template