What are Bookmarks in Power BI?
Power BI Bookmarks is a feature that allows you to save and capture the current state of a report page, including filters, slicers, visuals, and other settings. It creates a snapshot of the current view so you can return to it later or share specific views with others. You can add bookmarks by editing a report in Power BI Desktop and Power BI service.
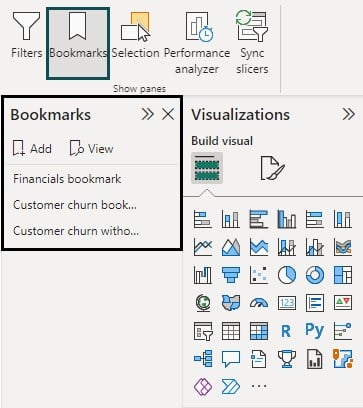
There are 2 types of bookmarks you can create and use in a report page. They include
| Bookmark Type | Bookmark Description |
|---|---|
| Report Bookmarks | Report bookmarks are added to reports by report owners who have edit permissions. When you share their reports with other users, the bookmarks travel with the report. This means everyone who has access to that report can also see and use the report bookmarks |
| Personal Bookmarks | Personal bookmarks can be created by anyone who can open a report, they don’t even require edit permissions. When you create personal bookmarks and share your report, the personal bookmarks don’t travel with the report. This means people who have access to that report won’t see or use the personal bookmarks. |
Power BI Bookmarks are useful for presentations, storytelling, and enabling interactivity within reports. By using bookmarks, you can guide users through specific insights and analysis, providing a more focused and engaging experience. You can also use bookmarks to keep track of your progress in creating reports or navigate back to bookmarked view in case of any changes to the visuals.
In the next section, we will learn how you can create bookmarks in Power BI.
Table of contents
Key Takeaways
- Bookmarks in Power BI allow users to save and capture specific views of a report page.
- They help in providing interactive and guided experiences for users during presentations or data exploration.
- Bookmarks can be created from the “View” tab and customized according to the desired view and interactions.
- The “Bookmarks” pane and optional bookmark toolbar aid in easy navigation between different bookmarks.
How to Create Bookmarks in Power BI?
To create bookmarks in Power BI, follow these steps:
Step 1: Open your existing Power BI report and navigate to the page you want to bookmark. You can also create a new report by importing the dataset to create a bookmark.
Step 2: Format the visuals, and apply filters, slicers, and any other settings to your report as per the reporting requirement you want to visualize.
Step 3: Click on the View tab in the Power BI ribbon at the top and then select the Bookmarks option.

Step 4: In the Bookmarks pane on the right side of the window, click on Add to create a new bookmark.
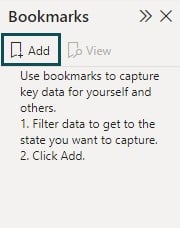
Step 5: Provide a descriptive name for the bookmark to identify it later quickly.
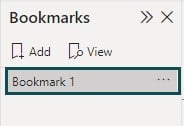
Step 6: Click on the ellipsis (…) to perform additional formatting such as Update, Rename, Delete, or Group. You can also define whether you want to capture the Data, Display, and Current Page state as part of the bookmark. You can also specify whether you want the changes for the selected visual or all visuals.

You can create multiple bookmarks on a single report page or multiple pages to capture different views of the data.
Power BI bookmarks keep filters intact, i.e., it retains active filters when the bookmark is created. The Power BI bookmarks selected visuals option captures the current state of visuals on a page for the selected visuals that can be restored in reports, and you can share Power BI bookmarks across the users. Similarly, Power BI bookmarks slicer captures the current state of slicers in a report.
📊 Unlock Advanced DAX Skills in Power BI!
Take your Power BI skills to the next level with our Advanced DAX in Power BI Training Course. Dive deep into advanced DAX functions, complex calculations, and optimization techniques to enhance your data analysis and reporting capabilities.
Examples
In this example, we have created two examples to demonstrate a step-by-step process for creating report bookmarks in Power BI.
Example #1
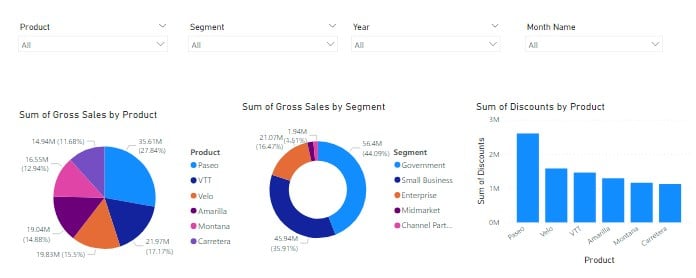
In this example, we will create a Power BI report showing a sales dashboard with different metrics using the Financials dataset in Power BI and then create a bookmark for the report. To create the Power BI bookmarks, follow these steps:
Step 1: Open the Power BI Desktop and import the Financials dataset using Data Connection.
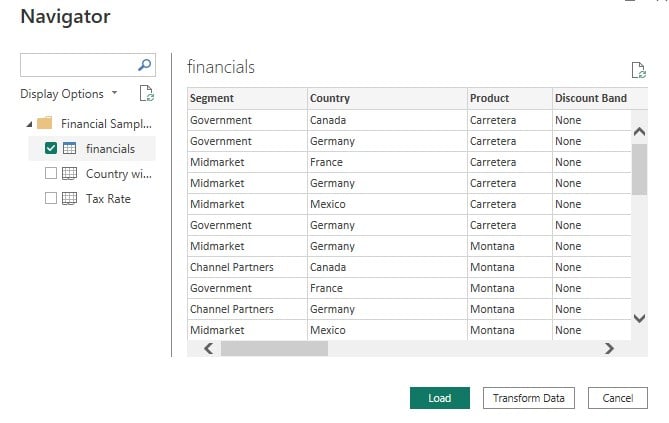
Step 2: Create Power BI reports by selecting the appropriate fields from the Fields pane and drag and drop them into the report canvas. Choose the visual from the Visualization pane for data visualization.
Here we have created 3 visuals i.e. an excel pie chart showing total gross sales by product, a donut chart showing total sales by segment, and a stacked column chart showing total discounts by product.

Step 3: Navigate to the Visualization pane and choose Slicer visual. Apply the formatting and appearance of the visuals by configuring the settings from the Format your Visual tab under the Visualization pane.
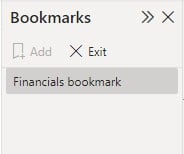
Step 4: Navigate to the View tab, choose Bookmarks, and click on Add to create a bookmark.

Step 5: Rename the bookmark to a meaningful description, and choose the details such as Data, Display, Current page, etc.
You can also choose All visuals or Power BI bookmarks Selected visuals as per the reporting requirements. You can rename, delete or update the bookmark as per the requirements.

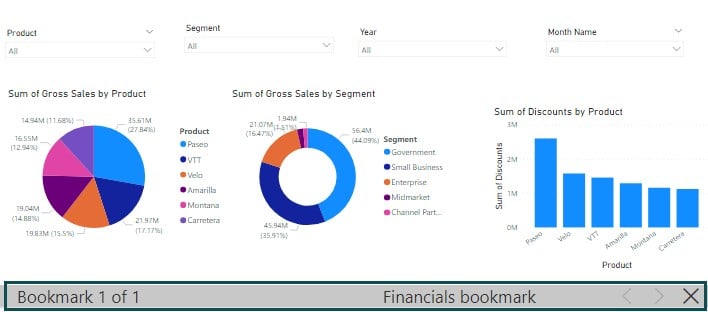
Step 6: Once the bookmark is created, click on View to view the bookmark.
You will see the bookmark details in the report canvas, which includes all the report’s slicers, filters, and formatting styles.
Example #2
In this example, we will create a Power BI report showing a credit balance dashboard using Customer-churn-Records dataset in Power BI and then create a bookmark for the report. To create the Power BI bookmarks, follow these steps:
Step 1: Open the Power BI Desktop and import the Customer-churn-Records dataset using Power BI Data Connection.

Step 2: Create Power BI reports by selecting the appropriate fields from the Fields pane and drag and drop them into the report canvas. Choose the visual from the Visualization pane for data visualization.
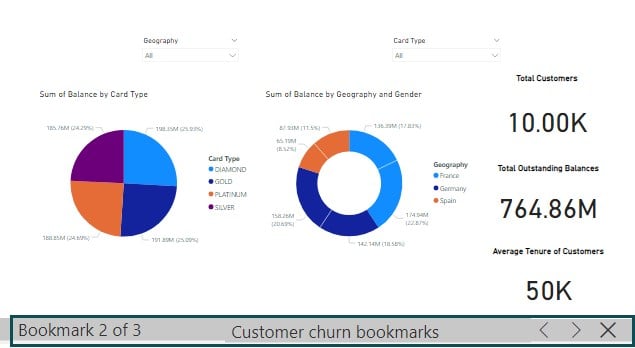
Here we have created three visuals, i.e., a pie chart showing the total credit balance by Card Type, a donut chart showing the total credit balance by Geography and Gender, and card visuals showing the total number of customers, outstanding balances and average tenure of customers.

Step 3: Navigate to the Visualization pane and choose Slicer visual. Apply the formatting and appearance of the visuals by configuring the settings from the Format your visual tab under the Visualization pane.

Step 4: Navigate to the View tab, choose Bookmarks, and click on Add to create a bookmark.

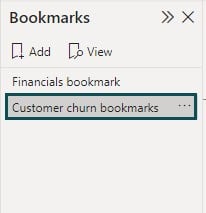
Step 5: Rename the bookmark and choose the details such as Data, Display, Current page, etc.
Here we have created customer churn bookmarks.
Step 6: Now navigate to the View tab and choose Selection.
You will see all the objects in the Selection pane.
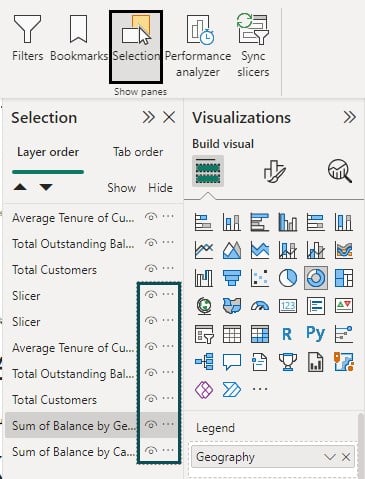
Step 7: Hide the visuals by selecting the eye icon to the right of the object.
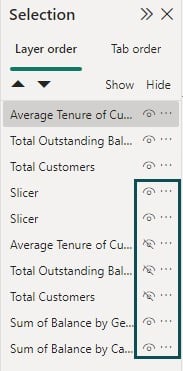
Step 8: Navigate to the Bookmarks pane and click on Add to create a bookmark.
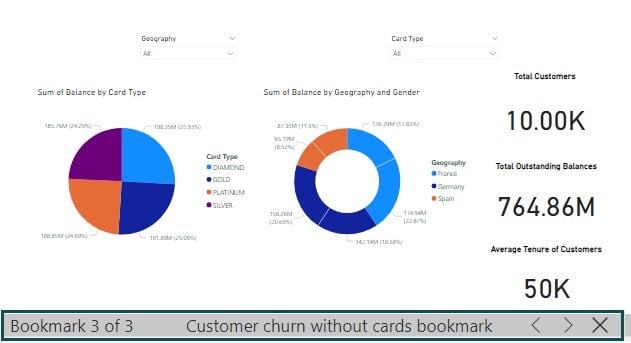
Here we have created Customer churn without cards bookmark.
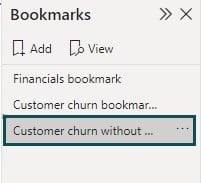
Step 9: Once the bookmarks are created, click on View to view the bookmark.
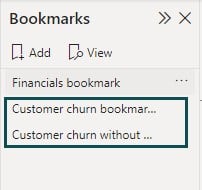
You will see the bookmark details in the report canvas, which includes all the report’s slicers, filters, and formatting styles.
Customer churn bookmarks
Customer churn without cards
Important Things to Note
Important things to note about the Power BI Bookmarks include:
- Though in most cases, Power BI functions well with bookmarks; however, in the event you face issues with the bookmarks, you should connect with the owner of the visual to add support for the incompatibility or fix.
- Any visual added on a report page post creation of a bookmark is displayed in its default state. Similarly, if you add a slicer to a page with an existing bookmark, the Power BI bookmarks slicer behavior moves to the default state.
- If you move a visual post creation of a bookmark, when you select the bookmark, the visual appears at the same place where you moved it.
- You can rearrange the order of all the bookmarks in a report, assign bookmarks to buttons and even create and bookmark groups.
- In Power BI, you can choose whether other visuals on the same page should be affected by the bookmark or not.
Frequently Asked Questions (FAQs)
To sync slicers with bookmarks in Power BI, follow these steps:
• Create a data visualization in Power BI or open an existing Power BI report and apply the required formatting and looks.
• Create the slicers in the report canvas you want to sync with bookmarks.
• Set up your report’s visuals, filters, slicers, and other settings..
• Create bookmarks by navigating to the View tab, clicking on the Bookmarks and selecting Add from the Bookmark pane.
• Click on More options (…) next to the bookmark’s name and deselect the Data option
If you use more than one bookmark in your dashboard, you must deselect each bookmark’s Data options.
There could be several reasons why bookmarks in Power BI may not be working:
• Incorrect configuration: Ensure that you have properly configured the bookmarks and included the relevant slicers and visuals in each bookmark.
• Disabled bookmarks: Check that the “Bookmarks” pane is enabled in the “View” tab. If it’s disabled, bookmarks won’t function.
• No bookmarks created: If you haven’t created any bookmarks, there won’t be any functionality to switch between different report states.
• Corrupted report file: In some cases, issues with bookmarks may occur due to a corrupted report file. Try creating a new report and reapply the bookmarks.
• Power BI version: Verify that you are using the latest version of Power BI, as older versions might have some bugs or limitations related to bookmarks.
• Custom visuals or unsupported features: If you are using custom visuals or certain unsupported features, they may interfere with bookmark functionality.
There are two types of Power BI bookmarks. They include the following:
There are two types of Power BI bookmarks. They include the following:
• Personal bookmarks
• These can be created by anyone who has access to a report regardless they have edit permission or not.
• When you create personal bookmarks and share the report with other users, they won’t be able to see these bookmarks and hence these are limited to the users who have created it
• Report bookmarks
• These are created by the report owners/designers who have edit permissions
• When you create report bookmarks and share the report with other users, they can see and use these bookmarks.
To update bookmarks in Power BI, follow these steps:
• Amend the visualizations, slicer selections, filters, and any other settings you want to update in your report.
• Navigate to the View tab, and click on the Bookmarks option.
• Click on More options (…) next to the bookmark’s name and choose the Update option from the menu. This will overwrite the existing bookmark with the current state of the report.
• If you have multiple bookmarks that need updating, repeat these steps for each of them.
Recommended Articles
Guide to Power BI Bookmarks & Buttons. Here we learn the step-by-step process for creating report bookmarks in Power BI with examples. You can learn more from the following articles –

Leave a Reply