
Power BI Calendar
A Power BI calendar table is a date table that contains a comprehensive range of dates and related attributes. A Calendar table can be used to analyze and visualize data in a time-based manner and typically includes columns such as the date, day of the week, month, quarter, year, and other relevant attributes. It is a fundamental component for creating time intelligence calculations and performing date-based analysis in Power BI.
Key Takeaways
- The Power BI Calendar function is used to return a table that contains a contiguous range of dates.
- There are DAX functions called CALENDAR and CALENDARAUTO in Power BI which help automatically create a calendar table.
- The CALENDAR function needs two inputs, the start date and the end date, while the CALENDARAUTO has an optional input.
- Remember to refresh the Power BI calendar table whenever you update your data to ensure it remains up to date.
How to Create Simple Calendar Table in Power BI?
You can create a simple Power BI calendar table using DAX functions such as CALENDAR or CALENDARAUTO.
The CALENDAR function requires two inputs, i.e., the start date and end date, and it returns a table with a single column containing a contiguous set of dates.

The CALENDARAUTO is a Power BI function is similar to the CALENDAR function, which returns a table with a single column containing a contiguous set of dates. However, CALENDARAUTO has an optional input, and it calculates the range of dates automatically based on data in the model.

Let’s now create a simple calendar table with a date range from 01-Jan-2023 to 31-Dec-2023 in Power BI using the CALENDAR function as per the steps provided below:
Step 1: Open Power BI Desktop. Navigate to the Modeling tab and select New Table from the Calculations ribbon.

Step 2: Enter the Power BI DAX expression using the CALENDAR function with the start date and end date as inputs.

Step 3: In the DAX expression, provide the start date as 1st Jan 2023 and the end date as 31st Dec 2023, using the DATE function to align with the input date format.

Step 4: Now click on the Commit icon to save the DAX expression.

It will create a Calendar Table Demo table with a Date column in Power BI.
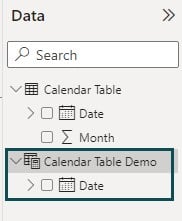
Step 5: Navigate to Data View to view the Calendar Table Demo table data

You will see 365 records with dates ranging from 1st Jan 2023 to 31st Jan 2023.

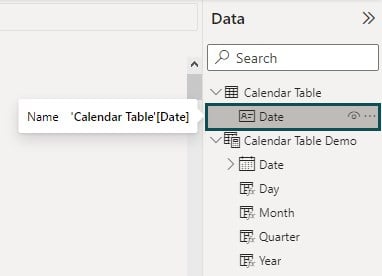
Now, you can also create additional columns such as Year, Month, Day, and Quarter as New Columns to this Calendar Table Demo to support any analysis in Power BI.
To create these columns, right-click the Calendar Table Demo and select New Column.
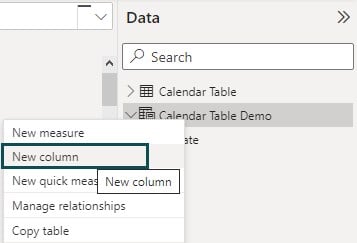
Enter the DAX expressions for each of the columns as provided below.
Year

Month

Day

Quarter

You will see the values of these columns in the Calendar Table Demo table in the Data View section.

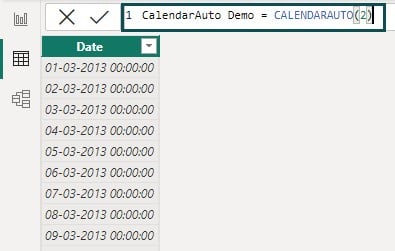
Similarly, you can also create a Power BI Calendar Table using the CALENDARAUTO function using DAX expressions, as shown below. In this case, you need to provide only one1 input i.e. fiscal_year_end_month.

Once committed, this function will create a Calendar table similar to the one made using the CALENDAR function.

However, the dataset in this table may vary depending on the value of fiscal_year_end_month you have entered.
For example: If you have entered the fiscal_year_end_month value as 2, the date range will start from the 1st of March.
However, if you have entered the fiscal_year_end_month value as 3, the date range in excel will start from the 1st of April.

Power BI Calendar Filter also allows you to apply filters based on date ranges or attributes. For example, For example, we can create a report of overall sales per product category only for the first three months using a filter on the Month column. We have created this column, Month, on the Calendar table using the Power BI.

Similarly, you can add the Power BI Calendar Slicer to allow users to select interactively specific dates or date ranges to filter the data displayed in the report or dashboard.
Build Calendar From Data Tables in Power BI
If you already have a data table that includes a date column, you can build a calendar table in Power BI using that existing data table. Here’s how:
Step 1: Open Power BI Desktop and connect to your data source.
Step 2: Navigate to the Modeling tab and then select New Table from the Calculations ribbon.

Step 3: Enter the DAX expression to create a Calendar table in Power BI and click on the Commit icon to save.

Note: Here, instead of providing a start date and end date, we have used MIN function and MAX function on the dataset.
It would create Calendar Table with a Date column.

Step 4: Select the Calendar table and navigate to Data View.
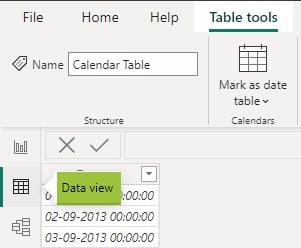
Step 5: Choose the appropriate date column in the calendar table and select Mark as date table.

It would open a pop-up window highlighting the column to select.

Step 6: Select the Date column and click on OK.

It will update the Date column to a Calendar table, which can be used to perform time-based analysis in Power BI.
Important Things to Note
- When creating a Power BI calendar table, ensure that the date column is in the correct format recognized by Power BI (e.g., Date/Time or Date data type).
- If using the CALENDAR function, ensure the start date is not greater than the end date. Similarly, if using the CALENDARAUTO function, the fiscal_year_end_month parameter must be between 1 and 12.
- The calendar table should cover a comprehensive range of dates that align with your data requirements.
- It is recommended to mark the calendar table as a date table and designate the primary date column to enable time intelligence calculations and analysis.
- You can enhance the calendar table by adding additional columns such as day of the week, month, quarter, year, fiscal periods, etc., to facilitate more advanced analysis.
- Remember to refresh the Power BI calendar table whenever you update your data to ensure it remains up to date.
- Both CALENDAR and CALENDARAUTO functions are not supported for use in DirectQuery mode if you are using it in Calculated Columns or Row-level security rules.
Frequently Asked Questions (FAQs)
In Power BI, the calendar and auto calendar are two different approaches to creating a calendar table.
Power BI does not support VBA (Visual Basic for Applications) macros. VBA is a programming language used in Microsoft Office applications like Excel, but it is not compatible with Power BI. Therefore, attempting to use the VBA code in Power BI for the calendar or any other functionality will not work. Power BI has its query language called Power Query (M) and calculation language called DAX (Data Analysis Expressions) for data manipulation and calculations.
The calendar table is a crucial component in Power BI for time-based analysis and performing time intelligence calculations. Some key uses of a calendar table in Power BI include:
• Time Intelligence: A calendar table enables you to perform various time-based calculations, such as year-to-date, month-to-date, quarter-to-date, same period last year, etc. These calculations help in comparing and analyzing data across different periods.
• Visualizations: Power BI visuals like line charts, bar charts, and scatter plots rely on a calendar table to accurately represent data over time. The calendar table provides the necessary date hierarchy for proper grouping and filtering in visualizations.
• Slicers and Filters: A calendar table allows you to create slicers and filters based on dates, enabling users to interactively drill down or filter data by specific periods.
• Business Analytics: The calendar table serves as a foundation for various business analytics scenarios, such as tracking sales performance over time, analyzing trends, forecasting, and comparing different periods’ metrics.
By incorporating a calendar table in your Power BI model, you gain the ability to leverage time intelligence features and perform in-depth analysis based on dates and periods.
Recommended Articles
Continue with these related resources when you want the next practical step in this topic.
- Power BI Dax
- Measures in Power BI
- Power BI Calculate
- Row Context and Filter Context in DAX
- Power BI Calculated Table
Explore the full Power BI Data Modeling and DAX guide or browse Power BI Resources.