What is a Paginated Report in Power BI?
A Power BI paginated report visual in Power BI is a type of report designed for presenting data in a format that’s optimized for printing or generating PDFs. Unlike the traditional interactive reports in Power BI, paginated reports are intended for producing fixed-format documents that are easier to print, share, or archive.
These reports are typically used for operational or operational reporting, such as invoices, sales orders, financial statements, or any document that requires a consistent layout. You can author a paginated report in the Power BI service using the Power BI paginated report builder tool.
Table of contents
Key Takeaways
- Power BI paginated report visuals are designed for fixed-format, print-friendly reporting.
- They offer precise control over formatting, data source connectivity, and export options.
- Use Power BI paginated report builder to create paginated reports and publish them to the Power BI service for sharing and exporting.
- While paginated reports have limitations, they are valuable for specific reporting needs, such as invoices and financial statements.
- A license is required to publish the report in the Power BI service
- Power BI paginated report visuals have certain limitations and you can export these reports to multiple formats such as PDF, Excel, Word, XML, and HTML
📊 Unlock Advanced DAX Skills in Power BI!
Take your Power BI skills to the next level with our Advanced DAX in Power BI Training Course. Dive deep into advanced DAX functions, complex calculations, and optimization techniques to enhance your data analysis and reporting capabilities.
Features
Power BI Paginated report visuals offer various features, including:
- Pixel-perfect formatting: You can precisely control the layout and formatting of your report.
- Export to multiple formats: Paginated reports can be exported to PDF, Excel, Word, and other formats.
- Support for parameters: You can create parameterized reports that allow users to customize the data they want to see.
- Data source connectivity: Paginated reports can connect to various data sources, including databases, Azure Analysis Services, and more.
- Subscription and distribution: You can schedule and automate the distribution of paginated reports to recipients via email or a shared folder.
- Interactive features: You can add interactive elements like hyperlinks and document maps to enhance the report’s usability.
How to Create a Paginated Report With Power BI Report Builder?
To create a paginated report with the Power BI paginated report builder, follow the steps outlined below:
Step 1: Set up pre-requisites for creating a paginated report
- Download and install Power BI paginated report builder, a standalone application for designing paginated reports. You can download it from the Microsoft Download Center.
- Create an Azure subscription if you don’t have and set up an Azure SQL database in the Azure portal.
- Ensure you have the required license for publishing the reports to the Power BI service. For a Free license, you can publish the reports to the Power BI service in your workspace. However, you need a Power BI Pro license or a PPU license to publish it to other workspaces.
Step 2: Create the matrix using the Wizard
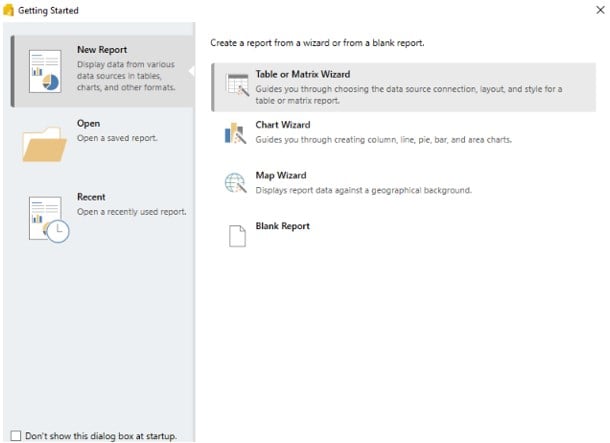
- Open Power BI paginated report builder, in your system and select New Report à Table or Matrix Wizard.
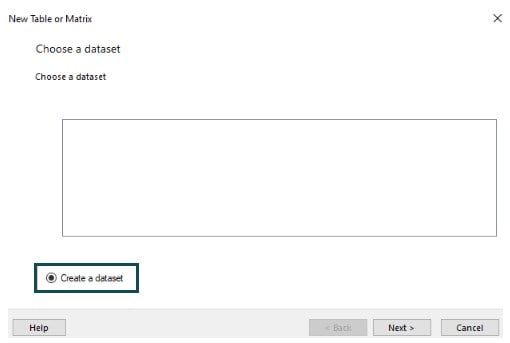
- Select Choose a dataset – Create a dataset – Next
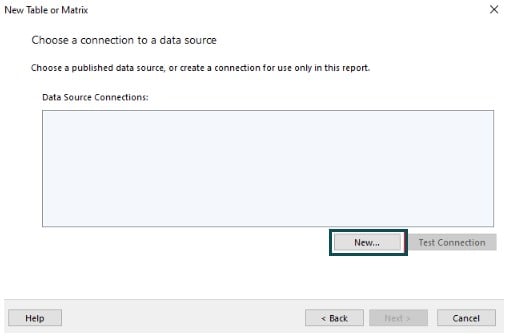
- Select New in the Choose a connection to a data source screen.
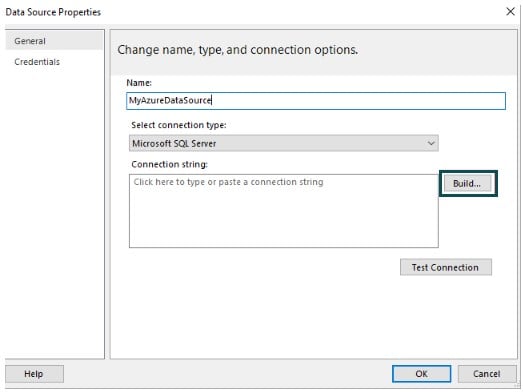
- In the Data Source Properties screen, provide the details and then click on OK.
- Navigate to the Azure portal and select SQL databases
- Choose the SQL database you have created in Step 1 and copy the Server Name in the Overview tab.
- Navigate to the Power BI Report Builder page, and paste the server name in the connection Properties screen.
- Provide the connection details as highlighted below.
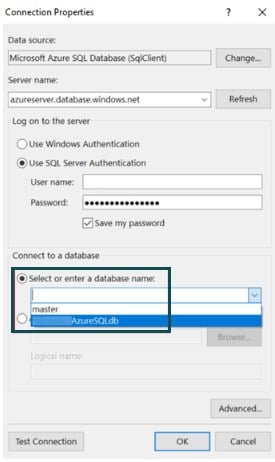
- Click on Test Connection to validate that the connection is successful.
- Navigate to the New Table or Matrix to choose the data source connection you have created, and then click on Next
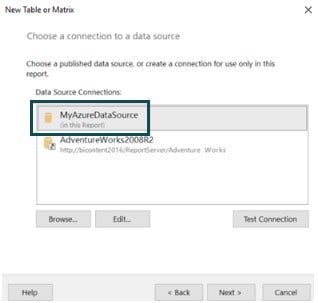
- Select the list of tables you want to use as part of building the reports, and then follow the next steps to finish the setup.
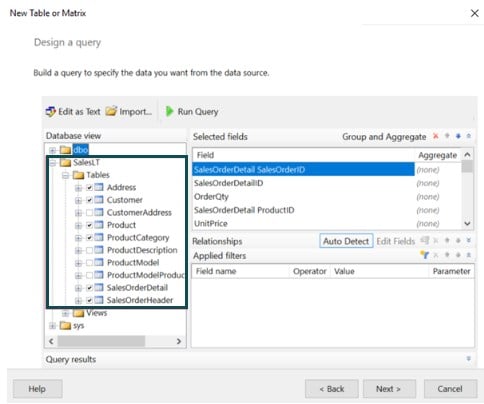
Step 3: Design your report: Create tables, matrices, charts, and other report elements to display your data. Use the drag-and-drop interface to format and arrange these elements as needed.
Step 4: Format your report
Once the report is created, you can format your report. It includes Setting up page width, adding report title, adding page numbers, setting up the table width, formatting any columns, adding column headers to each of the pages.
Step 5: Add parameters (optional): If you want to make your report interactive, you can add parameters that allow users to customize the data.
Step 6: Preview your report: Before finalizing, preview your report to ensure it looks as expected.
Step 7: Upload the report to the service
- Navigate to the Power BI Service à Workspaces à Create workspace à Upload à Browse for the Paginated report in your system à Open
- Once the report is uploaded, you can click on the ellipsis (…) and select the Manage option to edit credentials.
Now, you will be able to view the report in the Power BI service.
How to Publish a Paginated Report?
You can publish a paginated report to the Power BI service from the Power BI Report Builder or upload a paginated report to the Power BI Service.
To publish a paginated report from the Power BI report builder to the Power BI service, follow the steps highlighted below:
Step 1: Open the Power BI report builder and create a new paginated report, or you can open an existing paginated report from the Power BI service.
Note: For existing paginated reports in the Power BI service, the Save option is not enabled, given the report is already live in the Power BI Service.
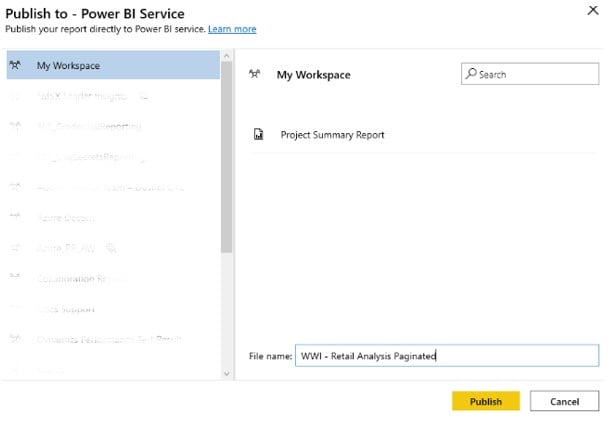
Step 2: Navigate to the File menu and choose the Publish option in the Power BI report builder. Ensure that you have signed into the Power BI. In case you don’t have an account in Power BI, you can create an account by using the Sign-in option available in the upper-right corner of the Power BI report builder.
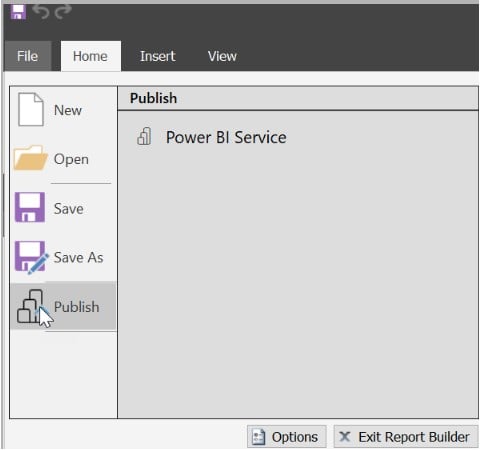
Step 3: Choose a workspace from the available list, search for a File name, and then Publish.
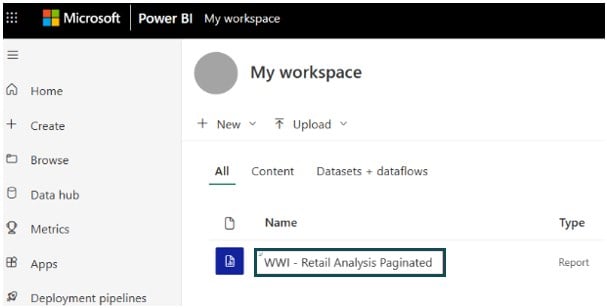
Step 4: Open Power BI Service in a web browser and navigate to the workspace where the paginated report was published.
Step 5: Select the report and provide the applicable parameters (if needed) to render the report in Power BI service

Upload a Paginated report from the Power BI service
To upload a paginated report from the Power BI service, follow the steps outlined below:
Step 1: Build a paginated report in Report Builder and save it to your local computer.
Step 2: Navigate to the Power BI service screen, choose the workspace where you intend to publish the report, select Upload, and then choose Browse to find the paginated report.

Step 3: Select the ellipsis (…) and choose the Manage option to edit your credentials. Configure your credentials for the report.

Step 4: Select the report and provide the applicable parameters (if needed) to render the report in Power BI service.

For on-premises paginated report data sources, you can further create or connect to a gateway to access the dataset by configuring the setting in Manage connections and gateways.

How to Export a Paginated Report?
You can export a paginated report from the Power BI service by following these steps:
Step 1: Open the Power BI service and navigate to the workspace containing your report.
Step 2: Locate the report and click on it to open it.
Step 3: Navigate to the report view, select Export under the Home tab, and then choose the desired export format (e.g., PDF, Excel, Word). You have multiple options for exporting the datasets such as CSV, HTML, and XML other than Excel, PDF, and Word formats.

Step 5: Configure export options if necessary and click on Export.
Step 6: The report will be generated in the selected format, and you can download it to your computer.
Limitations
- Paginated reports are less interactive than traditional Power BI reports.
- They may require more design effort, particularly for complex layouts.
- Data refresh and query performance are less optimized than in interactive reports.
- Paginated reports may not be suitable for all types of reporting needs.
- Paginated reports can’t render document maps in the Power BI service, though this isn’t a limitation if you export the report.
- Paginated reports don’t support shared data resources and datasets.
- Paginated reports don’t have data-driven subscriptions in the Power BI Service.
- You can’t pin Paginated report pages or visuals to Power BI dashboards.
Important Things to Note
The important things to note on the Paginated Report in Power BI include:
- Creating and viewing paginated reports may require a specific Power BI paginated reports license.
- Ensure that your data source is supported by Power BI paginated report builder.
- Carefully plan the report layout and formatting for optimal results.
- Your paginated report may appear as a blank page unless you provide the input parameters and select View report.

Frequently Asked Questions (FAQs)
You generally need a Power BI Premium or Power BI Premium Per User (PBI-P) license to create and publish paginated reports. These licenses allow you to use Power BI Report Builder, a separate tool for creating paginated reports. Users with free or Pro licenses can view paginated reports if they are published to a Power BI service workspace that is associated with a Premium or PBI-P capacity.
Paginated reports in Power BI can connect to a variety of data sources, similar to Power BI reports. Some common data sources include databases (e.g., SQL Server, Oracle, Azure SQL Database), data warehouses, SharePoint lists, XML files, OData feeds, and more. The specific data sources you can use depend on the connectors available in Power BI Report Builder.
Some of the key differences between Power BI reports and Paginated reports include:
Parameters are essential in Power BI paginated reports because they allow you to create flexible, dynamic reports. Parameters act as placeholders for values that can be passed at runtime, enabling users to customize the report output. For example, you can use parameters to filter data, change date ranges, or select specific categories for your report. Parameters make paginated reports more versatile and user-friendly, as they allow users to tailor the report’s content to their specific needs.
Recommended Articles
This has been a guide to Power BI Paginated Report. Here we learn the features, how to create, publish, and upload the report, with limitations & points to remember. You can learn more from the following articles –

Leave a Reply