What is R scripts in Power BI?
R scripts in Power BI allow users to leverage the capabilities of the R programming language for advanced analytics and data visualization. R is a powerful statistical computing language that enables users to perform complex data analysis, statistical modeling, and generate visualizations. Power BI seamlessly integrates with R, providing users with the ability to enhance their data analysis and visualization capabilities.
Table of contents
Key Takeaways
- R scripts in Power BI enable users to perform complex data analysis, advanced data modeling, and AI capabilities.
- R supports advanced features that include Advanced analytics, predictive analytics, data transformation, and statistical analysis. You can use R scripts in Power BI to create data visualizations.
- Despite advanced capabilities, R scripts have several limitations such as data size, output size, processing time, resolution, etc.
- R integration enhances Power BI’s functionality for users with a background in statistical analysis and programming.
- Consider performance implications and potential deployment challenges when using R scripts in Power BI.
📊 Unlock Advanced DAX Skills in Power BI!
Take your Power BI skills to the next level with our Advanced DAX in Power BI Training Course. Dive deep into advanced DAX functions, complex calculations, and optimization techniques to enhance your data analysis and reporting capabilities.
Features of R
Some of the key features of R scripts include:
- Advanced Analytics: R enables advanced statistical analysis and modeling that goes beyond the capabilities of standard Power BI functions.
- Data Visualization: R scripts can produce highly customized and sophisticated visualizations that may not be achievable with Power BI’s native visualizations.
- Predictive Analytics: R can be used to build predictive models and perform forecasting on your data.
- Data Transformation: R scripts can be employed for data cleansing, transformation, and manipulation.
- Statistical Analysis: R provides a wide range of statistical functions for in-depth analysis of your data.
How to use R scripts in Power BI?
To use R scripts in Power BI, follow the instructions outlined below:
Step 1: Install R into your machine. You can download and install R from multiple sources, including the official site of the CRAN repository.
Step 2: Enable R script in Power BI Desktop. Note that Power BI automatically enables the R script installation. You can validate the same by following the steps below:
Navigate to File – Options and settings – Options.

Under the Options page, select R scripting and validate that Detected R home directories reflect the actual installed path of R in your machine.
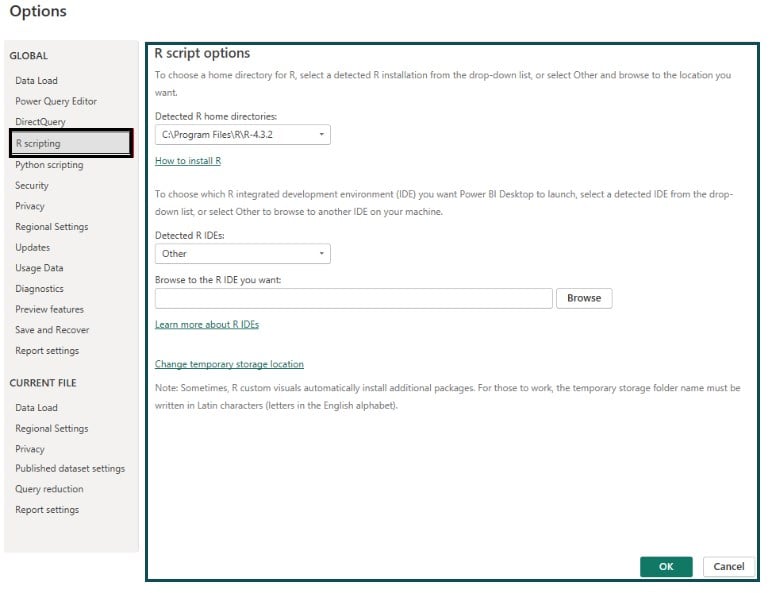
Step 3: Once you have enabled the R script in Power BI, create a data visualization in Power BI using the R scripts as per the steps below.
Navigate to the Visualization pane in Power BI and choose the R visual icon.
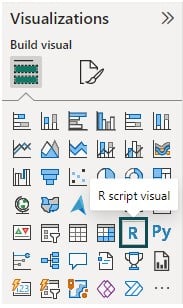
Click on the Enable button on the Enable script visuals window. You will notice an R visual image in the report canvas and an R script editor at the bottom of the center pane.
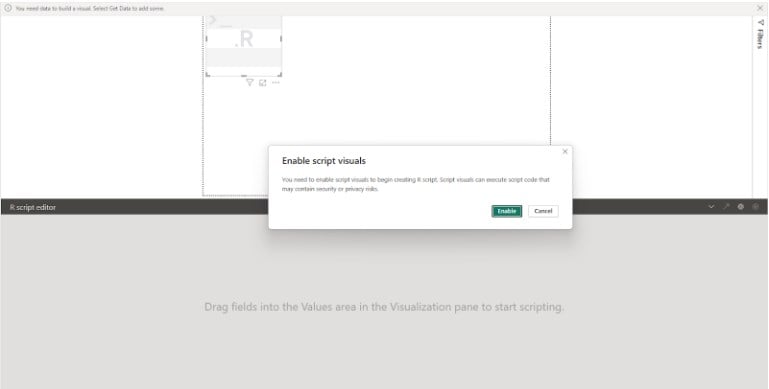
Drag and drop the fields to the Values section of the Visualization pane to start scripting. It will generate R script binding code by the R script editor.

If you change the field in the Values section, R script binding codes will automatically regenerate.

Add R script to Power BI using the R script editor and click on the run script icon to create a visualization in the report canvas.
In the next section, we will go through some examples to demonstrate how to use R scripts in Power BI.
Examples
In this section, we will demonstrate using R scripts in Power BI to create data visualization.
Example #1
In this example, we will plot visuals using R scripts in Power BI with the used Financials data to create the visual. The financials dataset contains the details of orders and the financial performance of a store. To create the visual in Power BI using R scripts, follow the instructions below:
Step 1: Download and install the R package into your machine.
Step 2: Enable the R script in Power BI Desktop as per the steps provided in the previous section.
Step 3: Import the Financials dataset to Power BI using a data connection and create visualizations by dragging the fields from the Fields pane onto the report canvas.
Step 4: Navigate to the Visualization pane in Power BI and choose the R visual icon.

Click on the Enable button on the Enable script visuals window. You will notice an R visual image in the report canvas and an R script editor at the bottom of the center pane.

Step 5: Drag and drop the fields from the Fields pane to the Values sections.
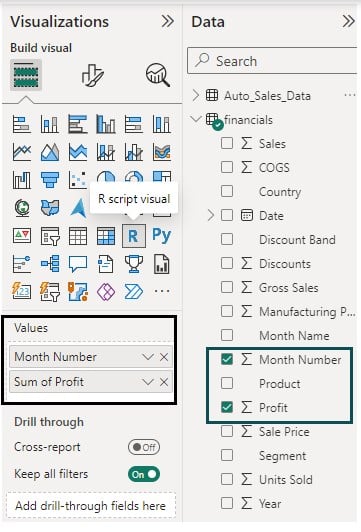
It will automatically add R scripts in the R script editor.
Step 6: Add the R script in Power BI using the R script editor and then run it by clicking on the execute icon to create a visual.
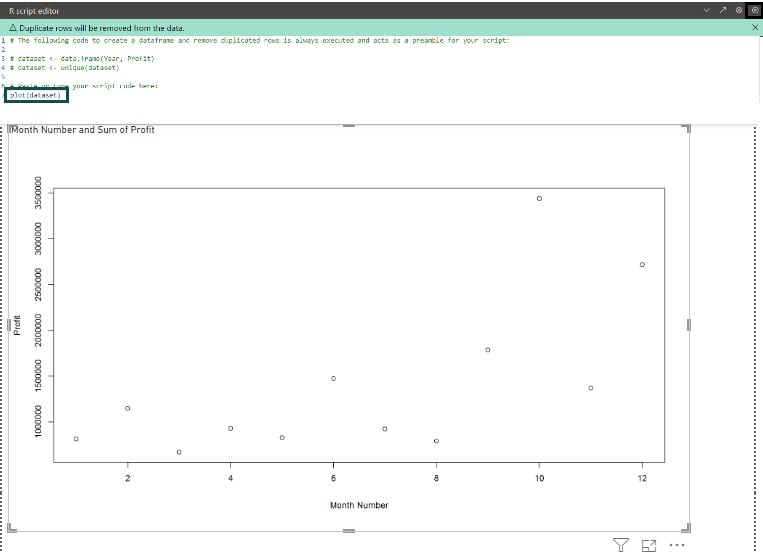
Step 7: Edit R script in Power BI to include additional changes to your visualization.
Example #2
In this example, we will plot various visuals using R scripts in Power BI. We have used the Auto_Sales_Data dataset to create the visual. Auto_Sales_Data dataset contains the details of the sales data of an automobile company.
To create the visual in Power BI using R scripts, follow the instructions below:
Step 1: Ensure that you have installed R on your machine to build the scripts. Validate that the R script is enabled in Power BI. Refer to Example 1 on guidance to enable R scripts in Power BI if required
Step 2: Open Power BI Desktop and import the Auto_Sales_Data dataset using the Get data feature available under the Home tab. Load the dataset into Power BI and apply data transformation if needed.
Step 3: Navigate to the Visualization pane in Power BI and choose the R visual icon.

Step 4: Power BI will present a pop-up window to Enable script visuals. Click on the Enable button on the Enable script visuals window.
It will create a R visual image in the report canvas and an R script editor at the bottom of the center pane.

Step 5: Drag and drop the fields from the Fields pane to the Values sections.
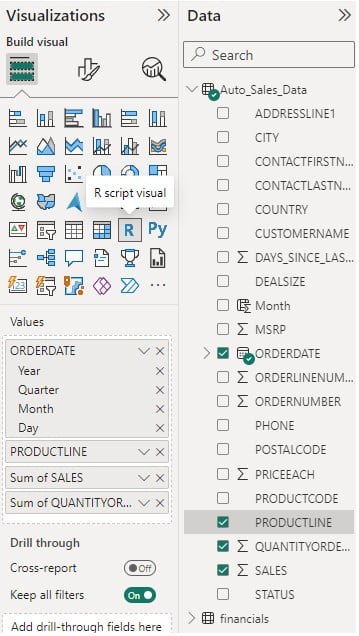
It will automatically add R scripts to the R script editor.
Step 6: Add R script in Power BI using the R script editor and run it by clicking on the execute icon to create a visual.
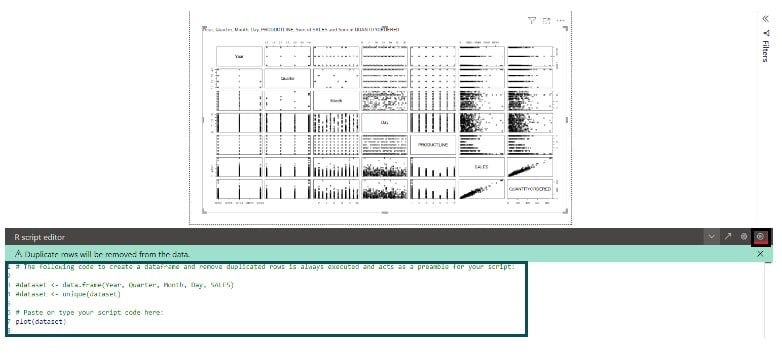
Step 7: Amend the visualization by editing R script in Power BI by navigating to the R script editor.
Here, we have created a bar chart.

The R script code looks like below.

Similarly, you can create a histogram using the histogram function in R.
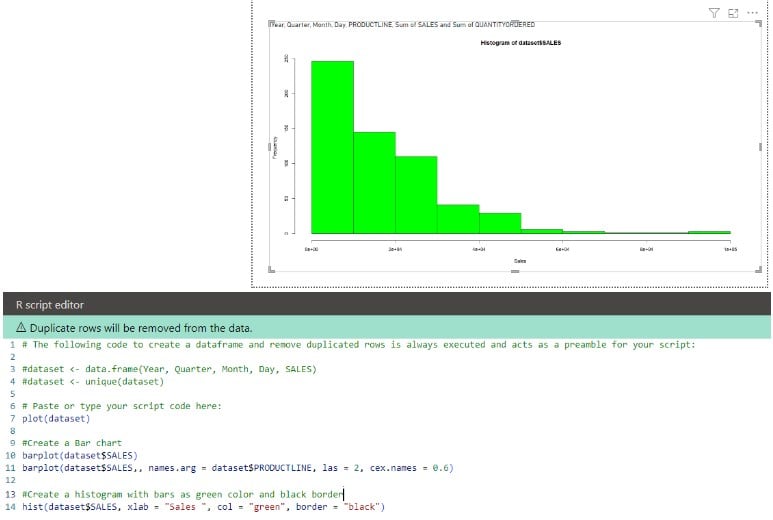
Similarly, you can also create a pie chart with the dataset as shown below.

Limitations
Despite the advanced capabilities that R scripts offer, they also have many limitations, as outlined below.
- The data size of underlying data used in R visuals for plotting can’t exceed 150,000 rows. If you attempt to include more than that, only the first 150,000 rows will be selected, and it will display a message over an image.
- The output size from an R visual can’t exceed more than 2MB.
- If you are performing any calculations in R visual that have a processing time of more than 5 minutes, you will see a time-out error.
- Visuals created using R scripts can only support a resolution of 72 DPI and plotting to the default device.
- If you are creating visuals using R scripts where the underlying tables don’t have any relationships defined then you will see error messages.
- You can’t rename the columns of visuals created in R scripts.
- Complex R scripts may impact performance, especially on large datasets.
- Users need to have some proficiency in R programming to take full advantage of this feature.
- Power BI relies on the R runtime, and any issues with the R environment can affect the functionality.
Important Things to Note
- R scripts are not included, deployed, and packaged by default in Power BI. Ensure that you have separately installed R on your system to execute the R scripts.
- Install and load necessary R packages at the beginning of your script using install. packages and library functions. Ensure that the required packages are available in your R environment.
- Be mindful of security implications when executing R scripts, especially if they involve external data sources.
- Parameterize your R scripts if you want to make them dynamic. Power BI allows you to create parameters that can be used within your R script to make it more flexible.
- Optimize your R code for performance, especially if dealing with large datasets.
- Document your R scripts thoroughly. This includes comments within the script and external documentation describing the purpose of the script, input data requirements, and expected output.

Frequently Asked Questions (FAQs)
• R is a powerful statistical language, and integrating R scripts into Power BI allows you to perform advanced analytics, statistical analysis, and machine learning directly within your Power BI reports.
• You can use R scripts to clean and transform data in Power BI. R provides a wide range of libraries and functions for data manipulation, allowing you to perform complex data-wrangling tasks seamlessly.
• R scripts enable the creation of custom visualizations in Power BI. You can leverage R’s extensive visualization libraries to generate unique and specialized charts, graphs, and plots that may not be available through the standard Power BI visualization options.
• R’s capabilities in predictive modeling and machine learning can be harnessed in Power BI to build and deploy predictive analytics models directly within your reports.
Yes, you can use R scripts for data cleaning, and transformation in Power BI. Power BI has integrated support for R, allowing you to leverage R scripts for advanced analytics and visualization tasks.
• You can use the “R script” option in the Power Query Editor to apply R scripts for data cleaning and transformation.
• In Power BI Desktop, navigate to Home – Transform data – Run R script.
• Write your R script in the editor, and it will be applied to the data in Power Query. This allows you to perform complex data manipulations and transformations using R.
Yes, you can create custom visualizations using R scripts in Power BI. To create custom visualizations using R scripts, follow the steps highlighted below:
• You can create a custom R visual by selecting the R script visual from the Visualizations pane.
• Write your R script to generate the desired visualization. Power BI will pass the relevant data to the R script, and the output will be displayed in the report.
• Ensure that your R script outputs a valid visualization, such as a ggplot or another graphical representation.
There are various possible reasons why the R scripts may not be working in Power BI. These include:
• Verify that R is correctly installed on your machine and that the R script execution is enabled in Power BI settings.
• Check the syntax and logic of your R scripts for any errors.
• Review the Power BI error messages for troubleshooting any error.
Recommended Articles
This has been a guide to R scripts in Power BI. Here we explain how to use R script power bi, with features, examples and limitations. You can learn more from the following articles –

Leave a Reply