
What Is Standard Deviation in Google Sheets?
The standard deviation in Google Sheets is used to measure how far a specific value varies from the mean of a set of values. It is used to find the variation of the values in a dataset and can be used to flag unusual events in real-time scenarios, like frequent complaints in business and so on. You can find if your data is in proximity to the mean or has wide deviations. For instance, let us look at a set of items sold in a bakery in two weeks. When you calculate the standard deviation using the STDEV formula as follows: =STDEV(B2:B5) and =STDEV(C2:C5), you get the following results.

The above results show that in Week 1, there is a spike in sales as it is 72 away from the mean, while week 2 has sales that vary 50 from the mean. Thus, you can estimate the mean and standard deviation in Google sheets.
Standard Deviation (SD) Formulas
Use this Standard Deviation in Google Sheets Template to follow along with the examples in this article.
Download Excel TemplateKey Takeaways
- In Google Sheets, we use STDEV.P to find the standard deviation of an entire population and STDEV.S for the standard deviation of a sample.
- The “S” in STDEV.S indicates “sample.” P indicates “population.” The syntax for these primary standard deviation function and all their related functions as well is given as STDEV.P(number1,[number2],…), where you can supply ranges and values as arguments.
- STDEVPA and STDEVA functions calculate SD, including text and logical values, and ignore empty cells.
- If any of the cells in a range contain text, STDEV ignores these cells. To calculate the standard deviation while interpreting the text values as 0, use STDEVA.
Standard Deviation (SD) Formulas
In standard deviation, there are terms such as sample and population which you often hear. Here, population refers to all the elements in a dataset, while sample includes one or more elements from the population. Depending on the situation, analysts use the sample and population data to calculate standard deviation in Google sheets. For example, to summarize the results of a class performance, the population SD is used, while a study on the impact of smoking in the age group of 30-50 years may include a sample SD for research and generalize it to the whole population.
So, let us look at the different syntax used to calculate the standard deviation of a sample or population.
Sample Standard Deviation (STDEV, STDEV.S, STDEVA)
#STDEV
The STDEV function, which is used to calculate the standard deviation of a range, straightforward to use. The syntax is as below:
=STDEV(value1, value2, …)
For the arguments, you can supply the list of arguments separated by commas or the range of cells. The STDEV function takes in the cells that you want to include in your sample and then calculates the standard deviation in Google sheets for that sample. You can enter single cells or ranges of cells as arguments.
From Excel 2007 onwards, STDEV can accept up to 255 arguments. These include:
- Values in numbers
- Arrays
- Cell references containing values.
#STDEV.S
The STDEV.S function calculates the Standard Deviation for a sample of a population based on the classic sample standard deviation formula. It is most commonly used in Google sheets now.
Its syntax is as follows:
=STDEV.S(value1, [value2, …])
You can include the values directly and ranges, or multiple ranges.
#STDEVA
It is used to calculate the standard deviation of a sample while setting text to the value `0.` The difference between STDEVA from STDEV and STDEV.S is as follows:
- It counts logical values (TRUE is taken as 1, FALSE is taken as 0).
- Text values are counted as 0, while text representations of values included directly in syntax are considered as numbers.
- It ignores empty cells.
Its syntax is as follows:
=STDEVA(value1, [value2, …])
You can include the values directly and ranges or multiple ranges. Now, let us look at the different ways to calculate the standard deviation of a population.
Population Standard Deviation (STDEVP, STDEV.P, STDEVPA)
Population Standard Deviation (STDEVP, STDEV.P, STDEVPA)
Let us look at the syntax in the case of a population standard deviation. These functions are based on the “n” method.
#STDEVP
STDEVP(value1,[value2],…)
For the arguments, you can either supply the values directly or multiple ranges.
In the newer versions of Excel 2010, this function is replaced by the STDEV.P function, but both can be used.
#STDEV.P
The syntax of the function currently used to find the standard deviation in a population is as follows:
STDEV.P(value1,[value2],…)
For the arguments, you can either supply the values directly or multiple ranges.
This formula is known to exhibit increased accuracy. The above two formulas count only the numbers.
#STDEVPA
STDEVPA(value1, [value2], …)
Like the sample SD, this is used to calculate the standard deviation of a population by including the text and logical values. It ignores empty cells.
Standard Deviation Calculation Example
Example #1 = Sample SD
Let us look at a set of values in Google Sheets representing the height of males and females taken from a particular area in a city. The first column represents the height in centimeters, while the second shows if the entry belongs to a male or female.

Step 1: Now, let us check the standard deviation of all the males and females in the group. Since we will be taking only a sample of the population, we will go with the formula STDEV.S.
Apply the following formula in cell D3.
=STDEV.S(A2:A7)

Step 2: Press Enter. You get the standard deviation in the heights of females.

Step 3: Now, the same can be applied to males as well. Use the formula as shown below in cell D4.
=STDEV.S(A8:A11). Press Enter.

Now, let us introduce some text in the table and apply the same formulas.

Step 4: Now, apply the formulas, =STDEVA (A2:A7) and =STDEVA(A8:A11), in cells D3 and D4,respectively. You notice that the text has been considered 0 by the function.

Step 5: Now, apply the formulas =STDEV.S (A2:A7) and =STDEV.S(A8:A11), in cells D6 and D7, respectively.

Notice the difference? It is because STDEV.S ignores the text, while STDEVA considers them to be 0.
Mathematically, the SD of a population is represented as:
σ = √Σ( xi – μ)^2/N
- σ = standard deviation of population
- Σ = sum
- xi = each value in dataset
- μ = population mean
- N = size of population
The SD of a sample is represented as:
s = √Σ( xi – x̄)^2/(n-1)
- s = standard deviation of sample
- Σ = sum
- xi = each value in sample
- x̄ = sample mean
- n = size of sample
Thus, the difference lies in the formula’s denominator. Here, n is used for a population, while n-1 is for a sample.
The choice between using STDEV.S or STDEV.P depends on the dataset you’re working with. If you have data for an entire population, which may not be often available, you must use the population type formula. If you have a sample of the population, you should use the STDEV.S version.
Example #2 – Population SD
Now, let us look at the ways to find the standard deviation of sample data. Let us consider a class of students and the grades they receive in two tests. Let us calculate the standard deviation under different scenarios for them.

Now, to calculate the standard deviation of the scores of this list, which includes the entire population, we use the formula STDEV.P. Let us implement the same.
Step 1: Let us implement the following formula in cell B13 to find the standard deviation of the scores in Test 1 from the mean.
=STDEV.P(B2:B12)

Step 2: As soon as you enter the formula, Google gives you the answer. Press Enter to get the result in cell B13.

Step 3: Using Autofill, drag the formula to cell C13. You get the standard deviation for Test 2.

Thus, we have found the standard deviation of the entire population here. Note that in Excel 2007 and its lower versions, you can also use STDEV or STDEVP.
Let’s apply the other versions of this formula for the standard deviation when it comes to a population. Let us tweak the table slightly. We can include two empty cells indicating the students haven’t attended the tests.
Step 4: When you apply the formula STDEV.P used earlier, you can see that it has ignored the empty cells.

Step 5: Let us introduce some text in these empty cells and apply the formula STDEV.PA. You can observe that it has taken the text values as zero, and the standard deviation is calculated accordingly.
Formula: =STDEVPA(B2:B12)
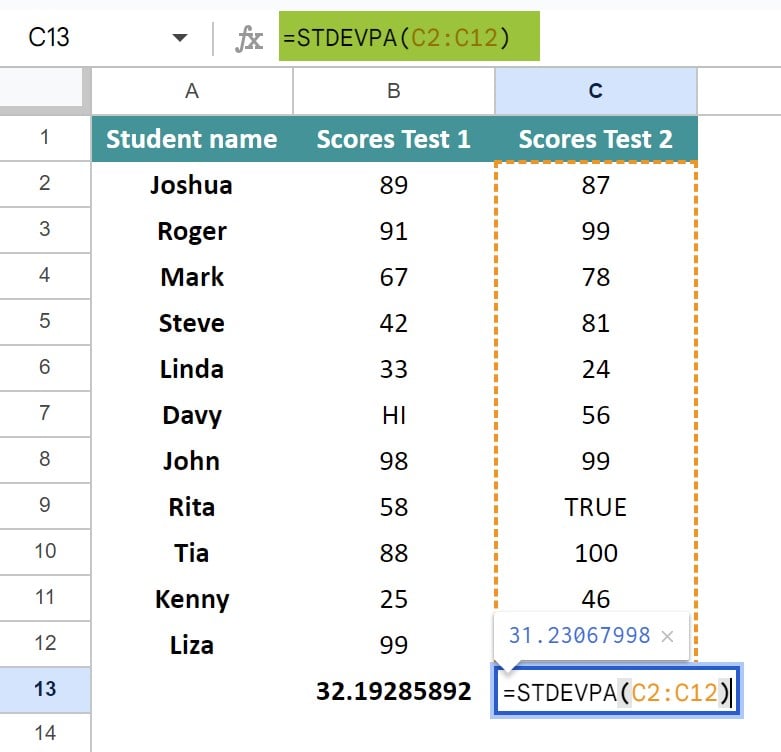
Thus, all the standard deviation in the Google Sheets formulas are simple to apply. Let us look at cases where you might get an error while calculating the standard deviation. Let us apply the STDEVPA formula to cells B2 to B12 and include a text in the values list.
As noticed before, the text in the dataset was ignored by the STDEVPA function. Apply the following formula in cell B14 and press Enter.
=STDEVPA(B2:B12, “HI”).
You observe that there is an #VALUE error.
Thus, any text in the cell range provided is taken as 0 by the STDEVPA function, while it throws an error when included in the argument list.
Note: If you have a mix of alphabet and numbers in your dataset and you want to extract the numbers for calculating the SD, you may use the SEARCH and RIGHT or LEFT functions to extract the number and the VALUE function to change it to an integer.
Add Standard Deviation Bars in Google Sheets
Let us look at how we can add standard deviation bars to a chart. The standard deviation bars show us how much the data varies from the mean, and they are similar to standard error bars. However, these bars are based on the actual standard deviation of the data rather than estimating it. Thus, the standard deviation in Google sheets graph, helps us make an accurate analysis of the data.
In our example below, a circus is tracking the number of viewers it gets in a week. Here, the error bars can be used to represent the standard deviation, which shows different numbers of viewers on different days.

Now, let us calculate the standard deviation of these values. Input the formula =STDEV.S(B2:B8) in cell B10. Press Enter. You get the standard deviation.

Step 1: To add the error bars to a chart, first select the data you want to use for the chart.

Step 2: Click on the “Insert” menu and select “Chart.”

Step 3: In the chart editor, select the type of chart that you want to create.

Step 4: Once the chart is created, you can customize the error bars and show the data variability. Click on the chart, then click on the “Customize” tab in the chart editor, and scroll down to Series.

Step 5: Look for the “Error bars” option and click on the checkbox. Here, select “Standard Deviation” from the drop-down given under “Type.”
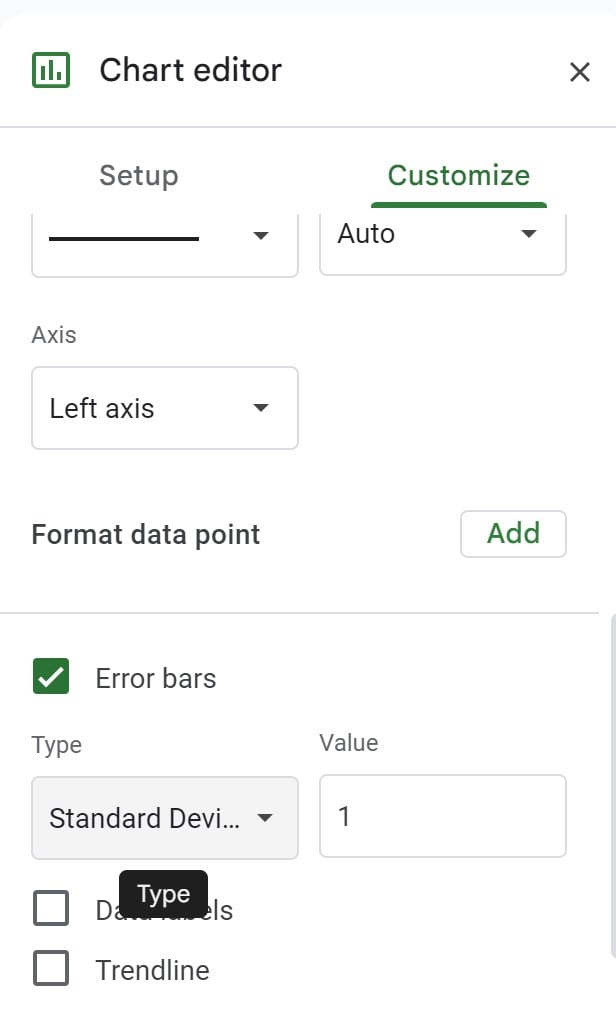
Step 6: Use the data from the “Standard Deviation” cell to display error bars. Thus, adding these error bars is an effective way to show the amount of variability of your data.

By inserting a chart and then customizing the standard deviation bars, you can create an impactful visualization that clearly shows the results of your analysis.
Important Things To Note
- While using the STDEV.P and STDEV.S and their related standard deviation functions, Google Sheets supports an arbitrary number of arguments for this function.
- By default, the Google Sheets STDEV is for samples.
- If the total values supplied as value arguments are not at least two, the STDEV functions will return the #DIV/0! error.
- STDEV.P and STDEV.S return an error if any of the arguments include text. To calculate the standard deviation while interpreting all the text values as 0, we use STDEVPA.
- The higher the standard deviation, the greater the variability. A lower standard deviation indicates less variability.
- You can combine the standard deviation functions STDEV.P and STDEV.S with other functions like AVERAGE to gain more insights from data analysis.
- Note that the STDEV.S and STDEV.P functions ignore Boolean values in the cell and range references but not when they are entered as arguments directly.
- Since the outcome of the STDEV formula has lot of decimals, you can change it by applying number formatting to it, if required.
Frequently Asked Questions (FAQs)
There are times when you may need to apply conditions to extract data points before you calculate the standard deviation. Under such conditions, you can use the Filter formula inside the STDEV formula. For example, if you want to calculate the standard deviation for only the days the weather of a city is above 30 degrees, you can type:
=STDEV(FILTER(B2:B10,B2:B10>30))
Here, the range is the cells containing the data (B2:B10) for the standard deviation. In the above formula, the FILTER function gives us just those values that are above 30, and the STDEV function uses these filtered values and gives the standard deviation for it.
In Google Sheets, we use two main functions to calculate the standard deviation of any data. The formulas may be chosen based on the data set you are working with. STDEV.P calculates the standard deviation for an entire population, while STDEV.S calculates the SD for a sample of that population.
Yes, it can be zero! If all of your data points are the same, the standard deviation will be zero, as there is no variability. A high standard deviation indicates that the data points are spread over a wider range of values.
Suppose there are blanks or text in your calculation and you wish to consider the text values as zero. In that case, you may use the STDEVA or STDEVPA function, depending on whether it is a sample or an entire population for which you are calculating the standard deviation.
Use this Standard Deviation in Google Sheets Template to follow along with the examples in this article.
Download Excel Template