
What is Storyline in Tableau?
Storyline in Tableau, also known as Tableau Story, refers to the logical sequence of visualizations placed one after another to convey a key theme or information to the users. Storyline helps you to transform the raw data into a structured outcome, a data narrative, contextual information, or an interactive, compelling presentation to help businesses identify a trend or pattern for making data-based decisions. The idea is to create a storyline through which a clear and insightful message can be imparted to the stakeholders.
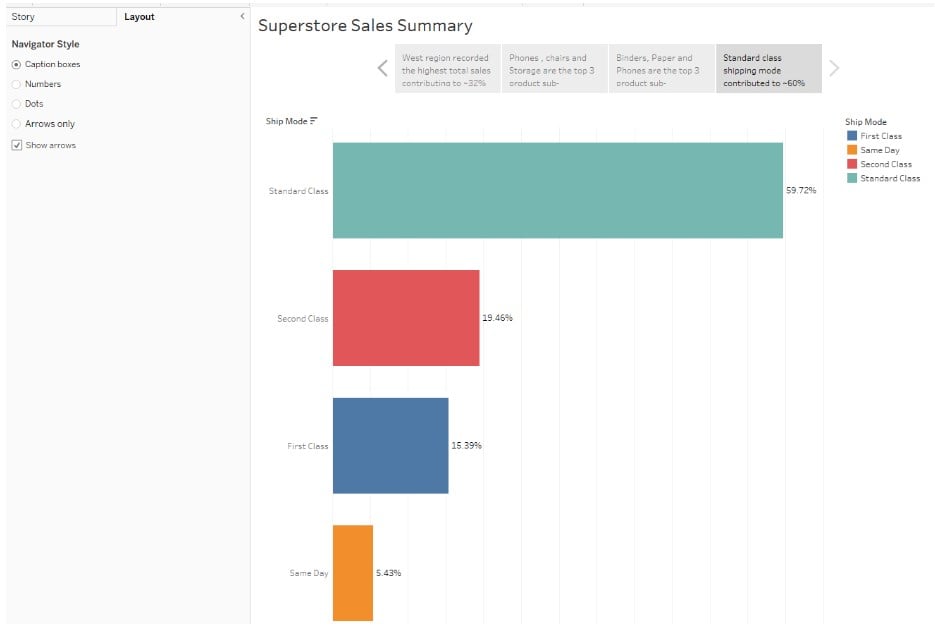
Storyline encompasses a collection of worksheets placed logically to demonstrate a model whose outcome can be linked to measurable business decisions. Once you create a storyline in Tableau, you can publish it to the web using the Tableau cloud or present the Tableau storyline to the end users in public. A sample storyline in Tableau looks like the one provided below:
Use this Tableau Storyline Template to follow along with the examples in this article.
Download Excel Template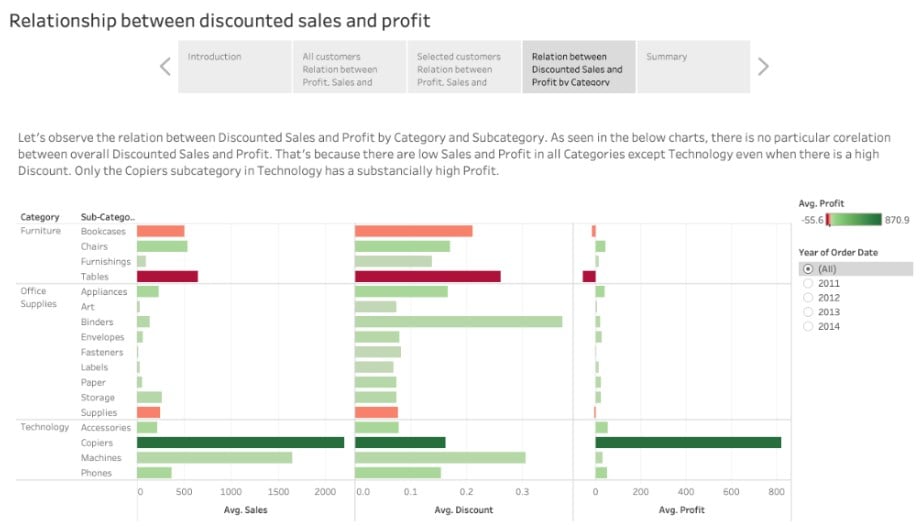
Key Takeaways
- Tableau storyline has a logical sequence of visualizations placed one after another to convey a key theme or information to the users.
- The storyline helps you transform the raw data into a structured outcome, a data narrative, contextual information, or an interactive compelling presentation to help businesses to identify a trend or pattern for making a data-based decision.
- Tableau storyline encompasses key components such as Tableau story points, title, caption, story layout and formatting and dashboard that make the storyline effective.
Components and Features
The key components and features of a storyline in Tableau include:
- Story Title – The overall Title of a Tableau story that outlines the central theme of the message
- Tableau story points – The individual sheet or slide in a story. Tableau story points are important components of a Tableau storyline and can contain
- Individual worksheets containing data visualization
- Single or multiple worksheets in a dashboard
- Data visualization with different sets of filters and annotations applied.
- Story Text – A text box that can be used to add texts, a caption, annotations, and other key information to provide clarity or message to the users.
- Dashboard – Based on the size of the story, you can fit a dashboard to it.
- Story Layout and formatting – Allows you to customize the story layout (thumbnails, etc.) and formatting options (color, size, font, etc.) to the story for end-user GUI look and feel.
- Story presentation – Enables you to present the story to the end users using the Presentation mode.
How to create a Story in Tableau?
To create a story in Tableau, you may follow the instructions outlined below:
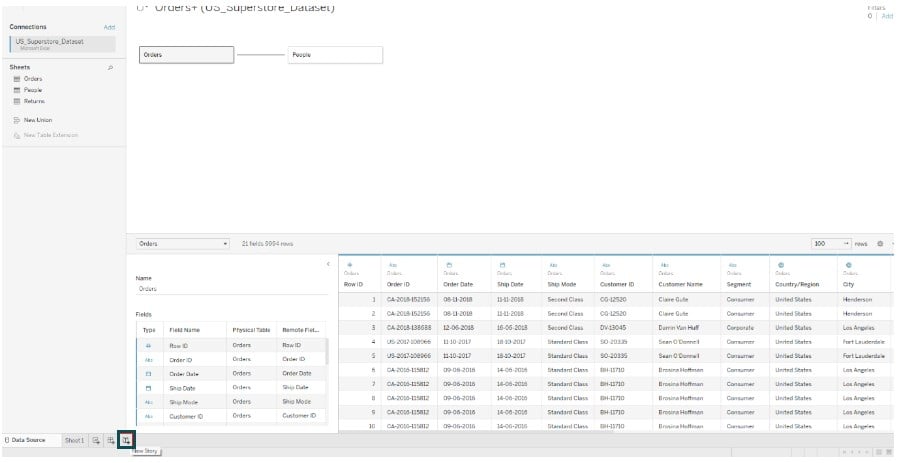
Step 1: Connect your dataset to the Tableau interface.
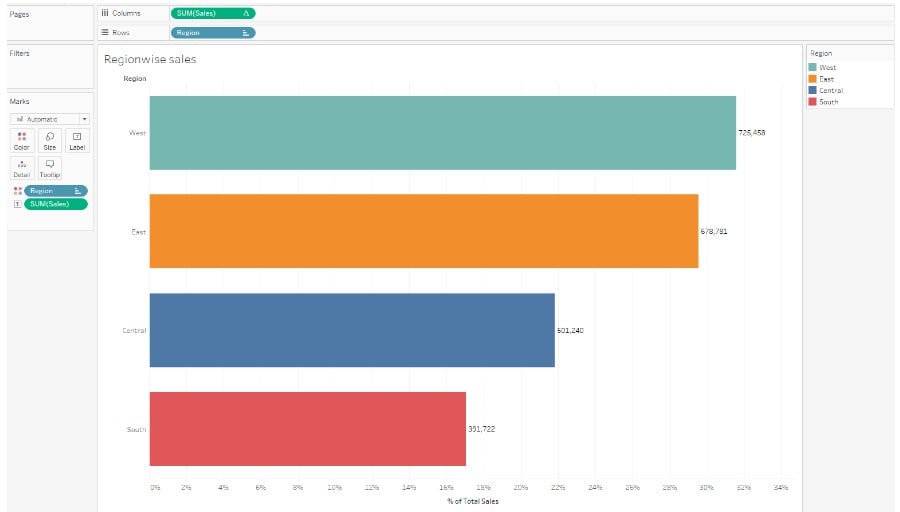
Step 2: Create a view by dragging and dropping the fields from the Data pane to the view.
Create multiple views in different worksheets the way we have created them.
- Regionwise sales
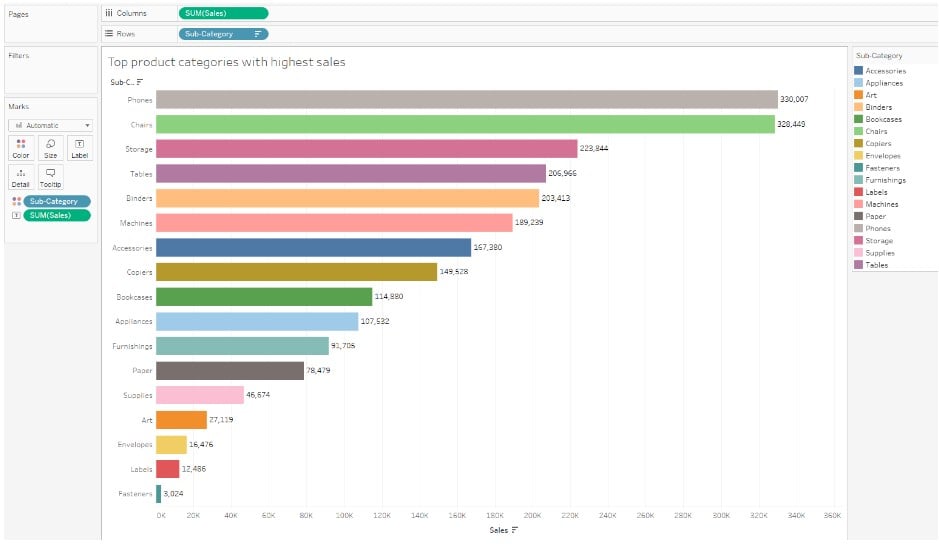
- Top Product categories with highest sales.
- Product categories with high returns:

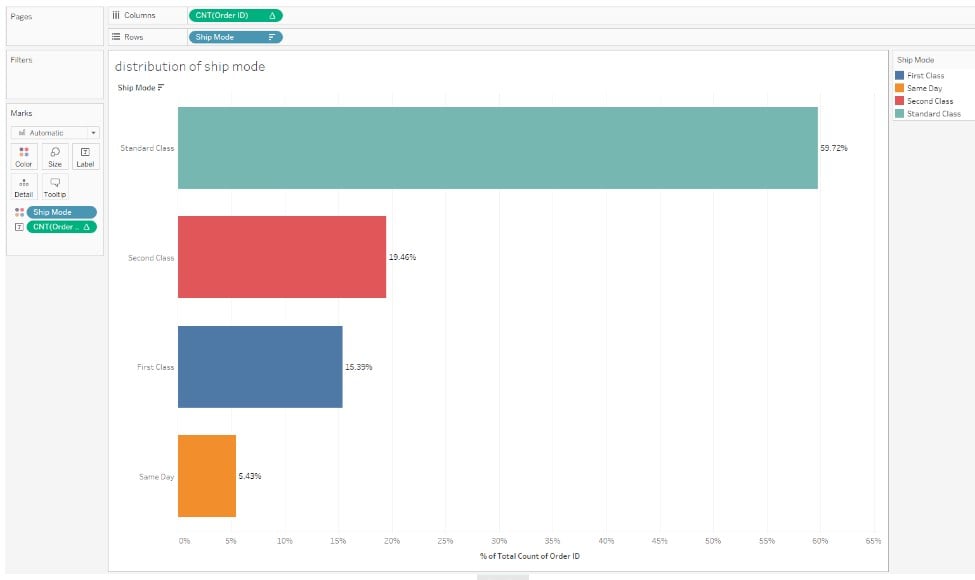
- Distribution of ship mode:
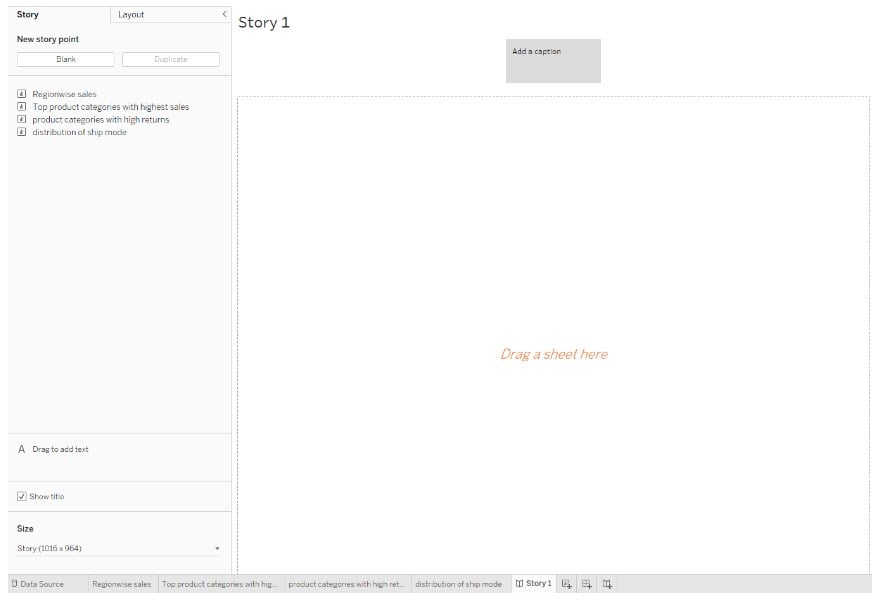
Step 3: Click on the New Story icon . You will see the Tableau story points in the Story pane.
Step 4: Add Story Title by right-clicking on the Story 1 and choosing Edit Title.
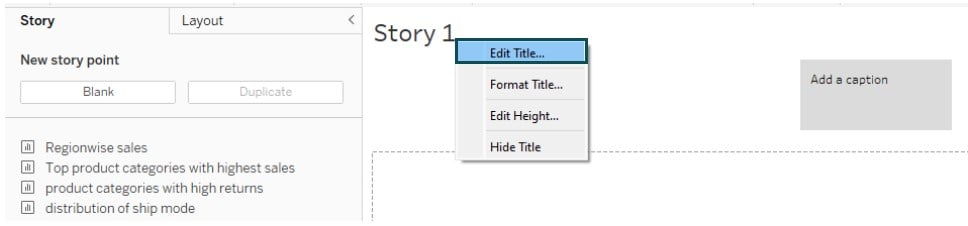
Step 5: In the Edit Title, add a Story Title. Click on OK.

Tableau will add a Story Title to your storyline.

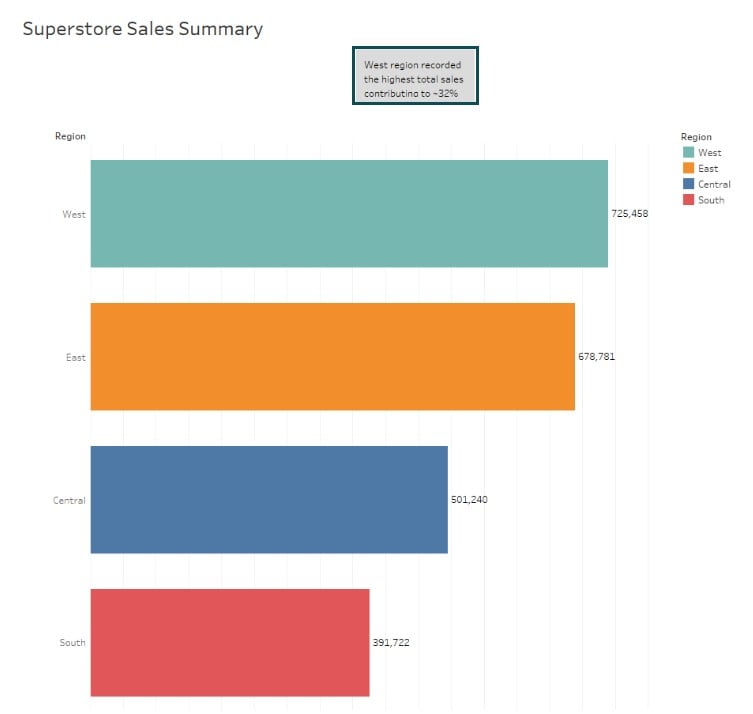
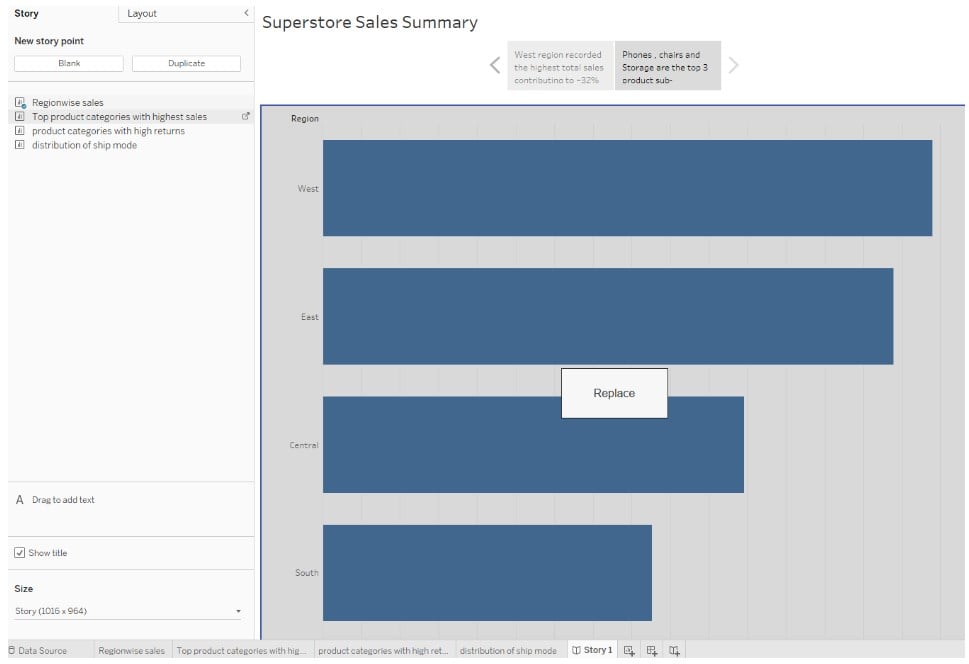
Step 6: On the Story pane, drag and drop a story point on the story sheet. Add text description in the Caption box.
Step 7: In the Story sheet, create another story by clicking on the Duplicate button in the Story pane.
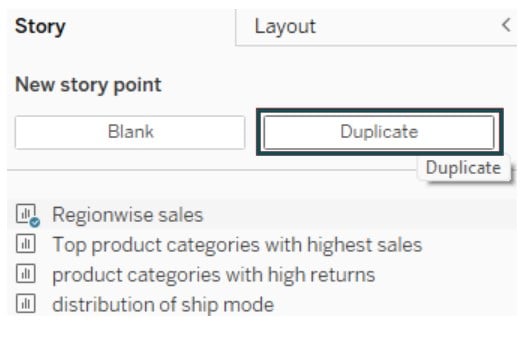
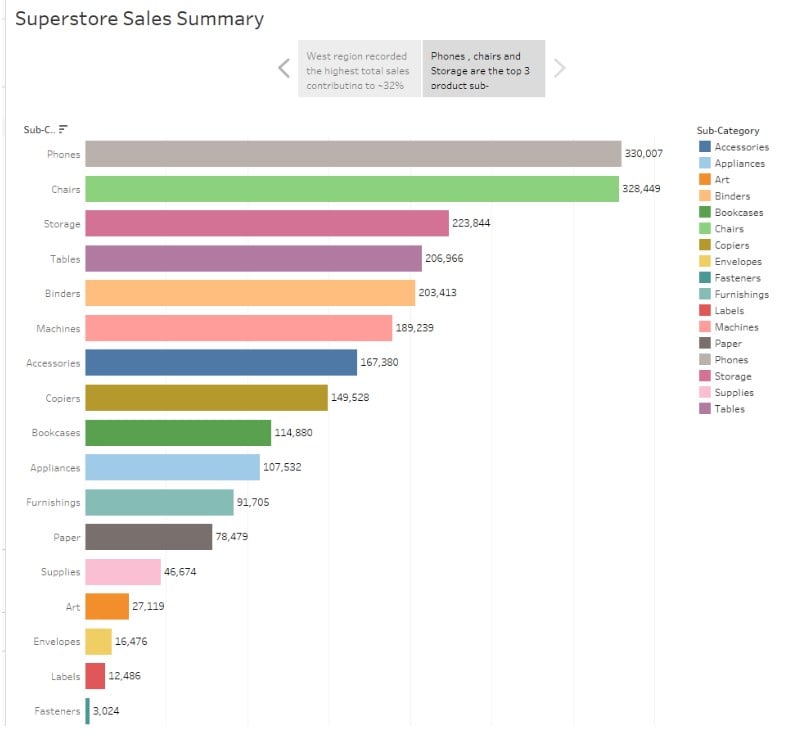
Step 8: Amend the text annotation in the caption box. Drag and drop the Top Product categories with the highest sales to the story sheet.
Now, the storyboard will display the Tableau storyline as per the sequence you have arranged in the story tab.
Step 9: Repeat the previous steps to create another story.
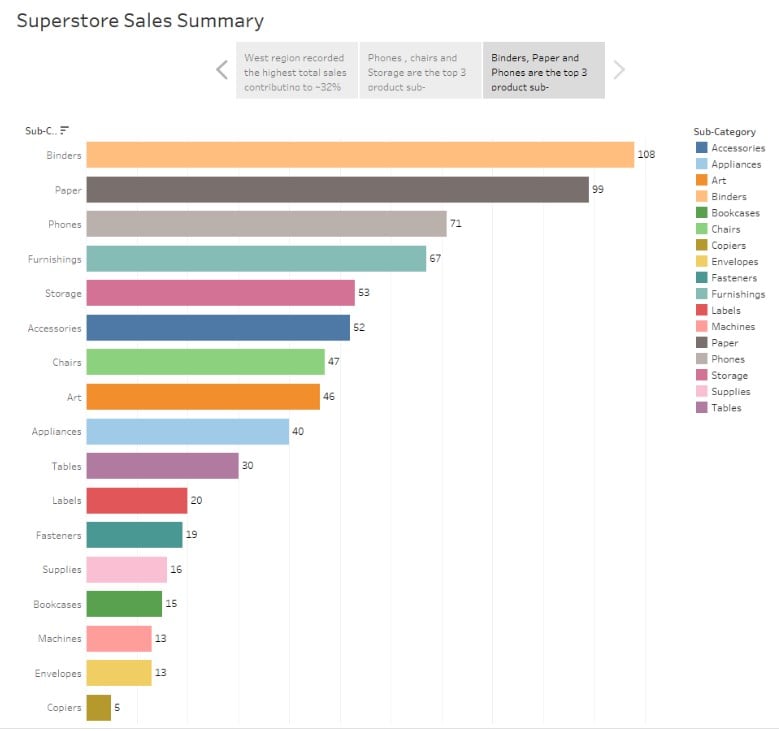
Another story has been created and added to the story sheet.

Step 10: Add navigation controls, story layout, and customization as appropriate.
Now your storyline in Tableau is ready for presentation or sharing to your users.
How to publish a Story in Tableau?
Depending on whether you are using Tableau Public or Tableau Server, you can publish your story as outlined below.
- Tableau Public:
To publish a Story in Tableau Public, follow the instructions highlighted below:
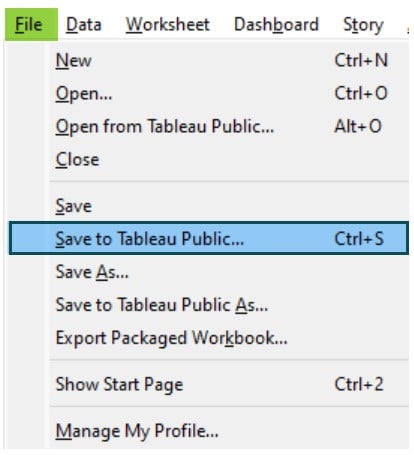
Step 1: Select File – Save to Tableau Public.
Step 2: Provide your Tableau Public Credentials and click on Publish. Tableau will publish the changes to Tableau Public.

The visual will be opened in a web browser.

- Tableau Server
Step 1: Navigate to Server – Publish Workbook.
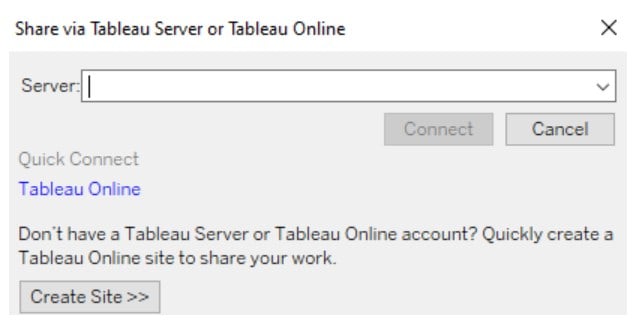
Step 2: Enter the Server details and click on Connect.
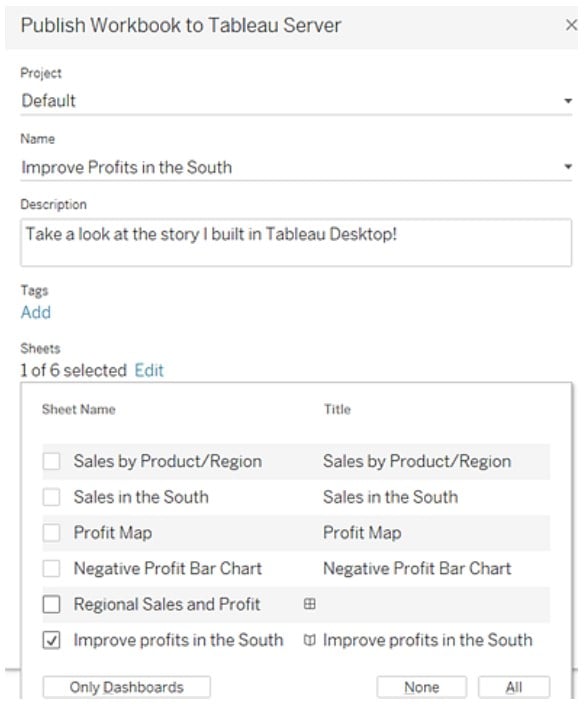
Step 3: Specify the details as highlighted below and click on Publish.
Step 4: Enter your Tableau Server credentials. Tableau will publish the story to the server.
Examples
In this section, we will demonstrate different examples that you can refer to create a storyline in Tableau.
Example #1 – Updating and Reformatting Objects
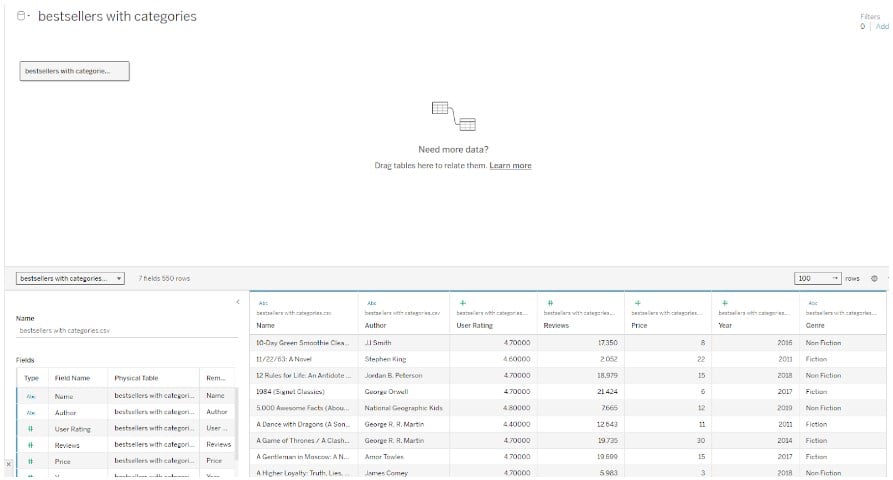
In this example, we will create a Tableau story and perform updating and reformatting objects using the Amazon Top 50 Bestselling Books 2009 – 2019 dataset which has information on Amazon’s Top 50 bestselling books from 2009 to 2019 and overall contains 550 books with details categorized into fiction and non-fiction.
To create a Tableau Story and then perform updating and reformatting objects, follow the instructions outlined below:
Step 1: Connect your dataset, i.e., Amazon Top 50 Bestselling Books 2009 – 2019 using the Tableau interface.
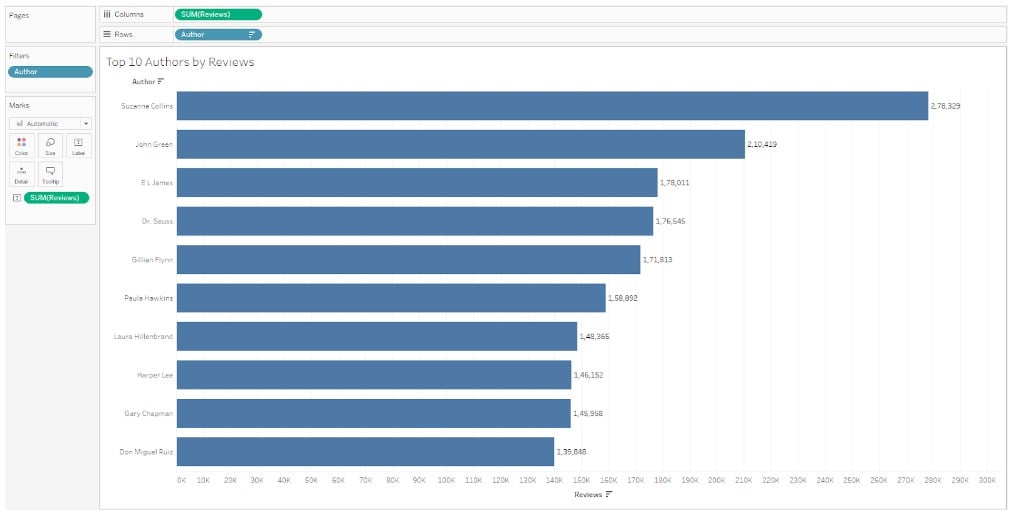
Step 2: Drag Reviews measure to the Columns shelf and Author to the Rows shelf.

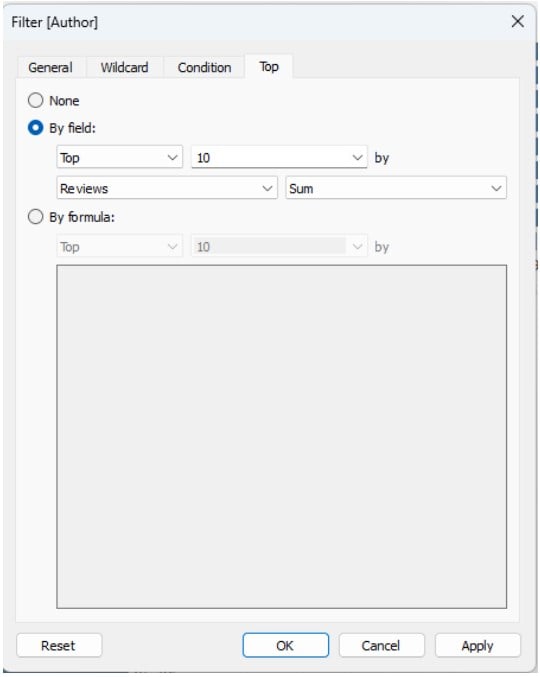
Step 3: Drag the Author field to the Filters pane. In the Filter screen, specify the logic for filtering the top 10 Authors by Total Reviews received.
Step 4: Label the view by dragging the SUM(Reviews) to the Label on the Marks card.

Step 5: Expand the view from Standard to the Entire View.
Step 6: In a new worksheet, create a Top 10 Books by Reviews visualization by dragging the Reviews to the Columns shelf and Book Names to the Rows shelf.

Step 7: Drag the Book Name to the Filters pane. In the Filter screen, define the filter condition to filter the top 10 books by reviews. Click on OK.
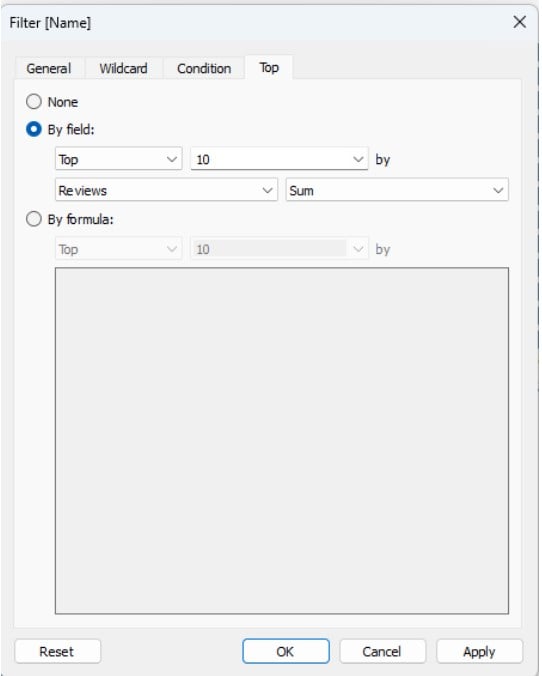
Tableau will display the Top 10 books by reviews in the view.

Step 8: Change the view from the Standard to the Entire View.

Step 9: Create a new visual to display the distribution of books by Genre using a Pie chart in the view.

Step 10: Click on a new story icon in Tableau. Tableau will display a blank Story1 tab with available story points under the Story pane.

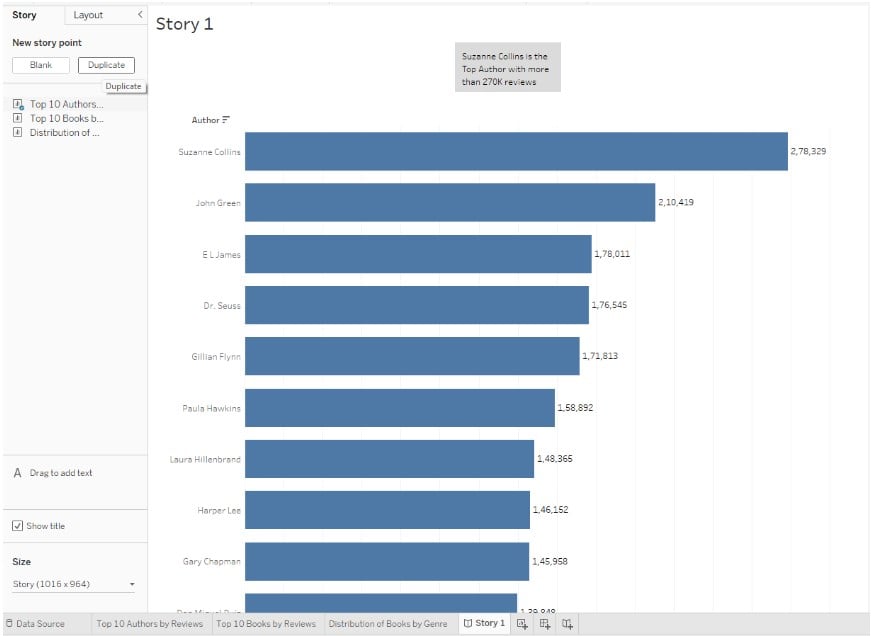
Step 11: Drag the Top 10 Authors by Reviews to the story view. In the text box, provide a story text to add context to the visual.

Step 12: Click on the Duplicate button to replicate the story created in the previous step.
Step 13: Drag the Top 10 Books by Reviews to the story view. You can notice that Tableau displays Replace text in the view.

Step 14: Repeat the previous steps to add a story to the view. Add the relevant story text to it.

Step 15: Navigate to the Top 10 Authors by Reviews worksheet and add Color based on Genre to the view.

Step 16: Repeat step 15 to add Color to the Top 10 Books by Reviews worksheet based on Genre.

Step 17: Right-click on the Story Title and choose Edit Title. Specify the text as applicable.

Now, your Tableau Story is ready for visualization.

Step 18: If you want to hide the title, right-click on the Title and choose Hide Title.
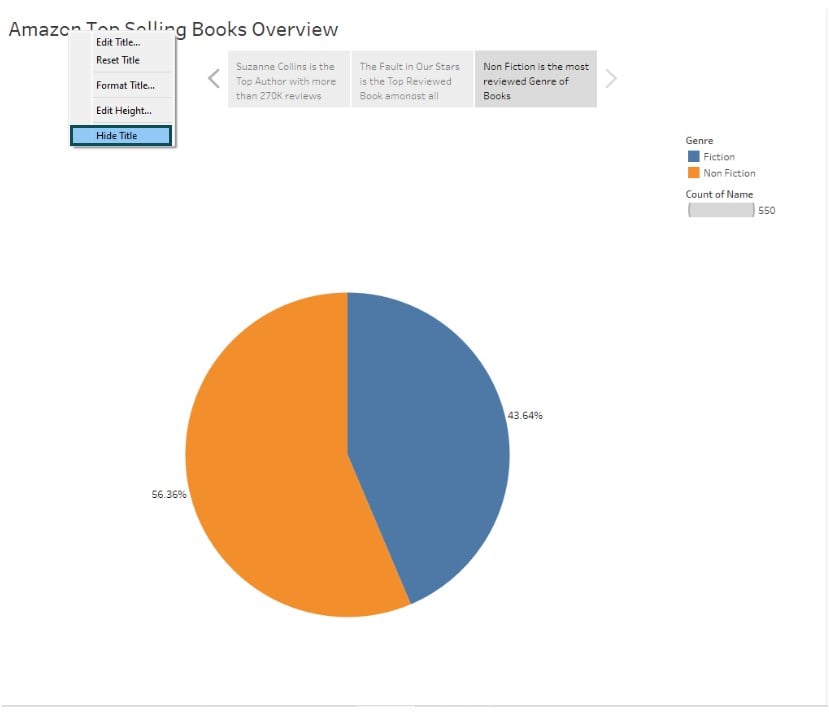
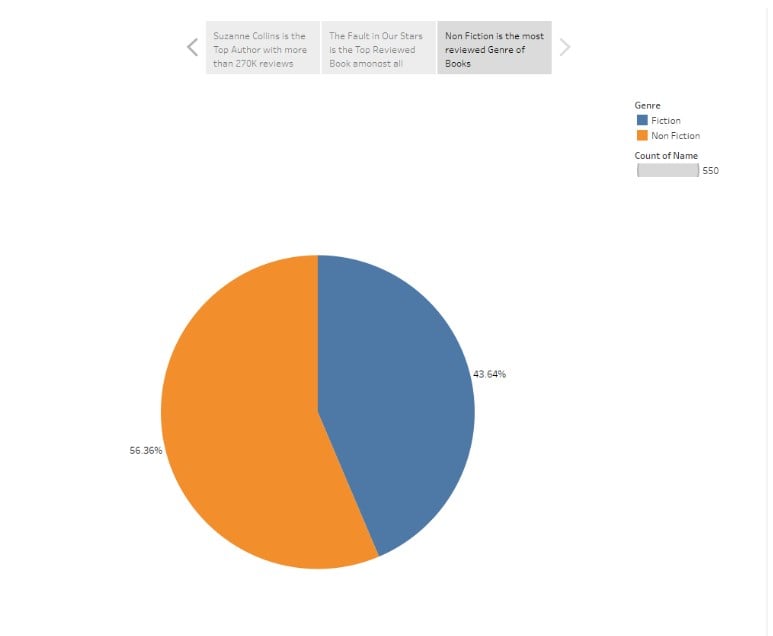
Tableau will hide the title, as shown below.
Step 19: Navigate to Layout and choose Numbers as Navigator Style. Tableau will update the Navigator with numbers.

Step 20: Navigate to Story – Format.

Step 21: Adjust Shading, Font, Alignment for the Title, Navigator, and Text Objects as applicable.

Tableau will update the visual as shown below.

Step 22: You can further amend the Alignment as applicable.

Step 23: You can delete any story if required by clicking on the Delete icon.

Example #2
Now, let’s look at creating another Tableau storyline using the Highest Holywood Grossing Movies. It contains information about the top 1000 highest-grossing Hollywood films.
Follow the instructions outlined below to create a storyline in Tableau:
Step 1: Import the Highest Holywood Grossing Movies dataset into Tableau public.

Step 2: In a new worksheet, create a visualization by dragging Budget and Title to the view.

Step 3: Right-click on Budget – Format.

Step 4: In the Format pane, choose Number (Custom) and specify the display units – Billions (B).

Step 5: Change the view to Entire View. Add the Year field to the Filter pane.

Step 6: Create another visualization to display the distribution of movie distributors based on worldwide sales. Format the view to display values in Billions(B).

Step 7: Apply the Top 10 Filter on the Distributor based on World Wide Sales.

Step 8: Create a new story.

Step 9: Drag Top 10 Movies by Budgets to the Story view. Add Story text to the view.

Step 10: Duplicate the story by clicking on the Duplicate button.

Step 11: Drag the Top 10 Distributors by World Wide Sales to the view.

Tableau will display Replace text in the view.

Step 12: Amend the Story text as per the visual.

Step 13: Customize the visualization in the Format Story pane.

Step 14: Provide a meaningful title to the story.

Now your Tableau storyline is ready for visualization.

Importance Things to Note
- Tableau storyline must be focused on a specific data narrative to ensure a compelling message is communicated to the business users.
- To the extent possible, always ensure clear text annotations, optimal visualizations, and logical arrangements of visualizations to make your Tableau storyline effective
- Evaluate how to use the Tableau story points efficiently and ensure there are clear and impeccable captions that capture the theme of the narrative of your storyline.
Frequently Asked Questions (FAQs)
The differences between the Tableau storyline and the traditional dashboard are outlined below:
As per the latest Tableau documentation available, Tableau doesn’t support multimedia elements like images or videos into Storyline. However, you can use images as background setup, embed web objects, annotations, and text boxes or hyperlinks to your storyline.
While there is no documentation available in Tableau in terms of the number of visualizations that you can include in a Tableau Storyline, it is worth noting that too many visualizations may not be ideal. There should be consideration of visual performances, user experience, and clarity of the visual to decide the number of visualizations you want to include in Tableau storyline.
Yes, Tableau Storyline supports storytelling techniques such as annotations. You can use the annotations to add text context and explain specific data points and narratives. You may use Mark annotations, Point annotations, or Area of visualization in your storyline.
Use this Tableau Storyline Template to follow along with the examples in this article.
Download Excel TemplateRecommended Articles
Continue with these related resources when you want the next practical step in this topic.
Explore the full Tableau Charts and Dashboards guide or browse Tableau Resources.