What is Excel VBA Charts?
VBA Charts visually represent the data based on the user’s chosen chart type. Remember that VBA Charts are of type objects; whenever we must refer to them, we must remember to refer to them as objects.
In an Excel worksheet, we go through a manual process of creating a chart to visualize the data, but in VBA charts, this process can be automated with some simple code. For example, look at the following data in Excel.
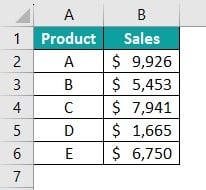
We have a product-wise sales information table from A1 to B6. We can use the following code and insert simple VBA charts.
Sub VBA_Charts()
Dim Ws As Worksheet
Dim Product_Chart As Object
Set Ws = ActiveSheet
Set Product_Chart = Ws.Shapes.AddChart2
With Product_Chart.Chart
.SetSourceData Range(“A1:B6”)
.ChartType = xlColumnClustered
.ChartTitle.Text = “Product-wise Sales Performance”
End With
End Sub
When we run this code, we will get the following chart.
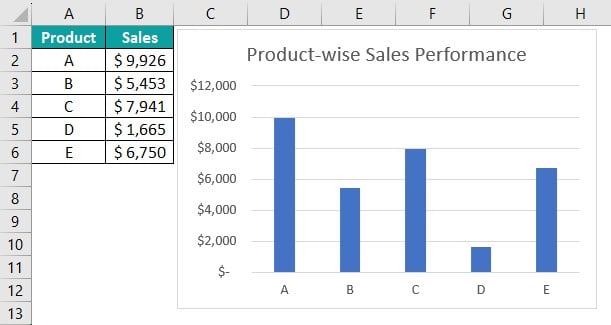
Table of contents
Key Takeaways
- VBA Charts collection is part of VBA object collection.
- By default, the chart will be inserted in a separate worksheet.
- To insert a chart in the same worksheet, we must use the worksheet reference, and in that worksheet, we must use the chart.add method.
- We can loop through all the charts using FOR EACH loop.
- VBA Chart title can be changed using the ChartTitle.Text property.
- VBA Chart export to PDF can be done by saving the chart in PDF format.
Excel VBA 5-in-1 Course Bundle – (30+ Hours of Expert-Led Training)
If you want to learn Excel and VBA professionally, then the Excel VBA 5-in-1 Course Bundle (30+ hours) is the perfect solution. Whether you’re a beginner or an experienced user, this bundle covers it all – from Basic Excel VBA to Event Automation, Error Handling, Email Automation, and real-world applications with downloadable templates.
How to Add Charts Using VBA Code in Excel?
Let us show you a step-by-step approach to creating VBA charts using VBA code. Follow the examples and steps listed below.
Example #1 – Create Charts Using VBA Coding
It is vital to have data to create any chart; charts are just a visual representation of data. Hence, we have the following data, which we will use to add a chart using VBA Charts.
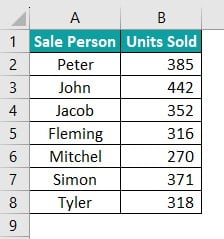
It is the data on the number of salespersons who have sold mobile phones in a month. Let’s visualize this data using VBA Charts.
Step 1: Start the subroutine procedure by naming the macro.

Step 2: We must define a variable as a Chart object data type.
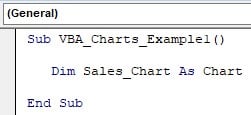
Step 3: The defined variable “Sales_Chart” is an object variable; hence, we must set the reference for the chart using the “Set” keyword.
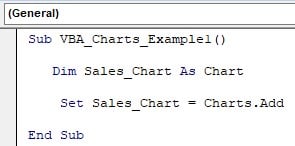
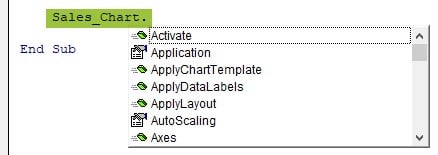
Step 4: Once we set the reference using the “Set” keyword, we can access all the Chart’s properties and methods using the variable name “Sales_Chart.” Enter the variable name followed by a dot to see the IntelliSense list showing all the available properties and methods of the chart.
Step 5: The first thing we must do with charts is to set the data range area. To do this, use the “SetSourceData” method of the Charts object.
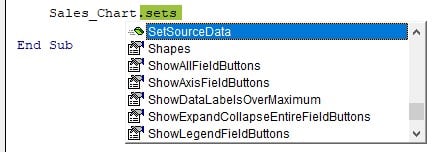
We can see its arguments once we select the “SetSourceData” method.

Step 6: For the “Source as Range” argument, we must choose the data range from the worksheet. Let’s provide the data range from A1 to B8.
Before providing the data range, we need to keep one thing in mind, i.e., we must give the data range along with the worksheet name.
Here, the data is in the worksheet “Sales Data.”

Let’s give the data range along with the worksheet name.

Step 7: Next, we must choose the “chart type,” i.e., what type of chart must be inserted to visualize the source data.
Enter the chart variable “Sales_Chart,” and choose the chart type from the IntelliSense list.
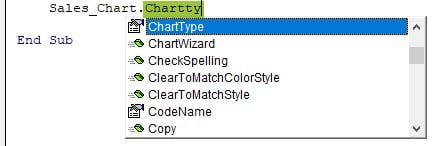
Step 8: After choosing the chart type property. Enter an equal sign; we will see all the pre-defined charts listed.

Step 9: Choose “xlColumnClustered” to insert the column bar chart.

Step 10: We must insert a chart title once the chart type is decided. For that, use the “ChartTitle” property and set it by entering an equal sign.

This is sufficient to start with VBA Charts. Following is the complete code:
Sub VBA_Charts_Example1()
Dim Sales_Chart As Chart
Set Sales_Chart = Charts.Add
Sales_Chart.SetSourceData Worksheets(“Sales Data”).Range(“A1:B8”)
Sales_Chart.ChartType = xlColumnClustered
Sales_Chart.ChartTitle.Text = “Sales Performance”
End Sub
Let’s execute the code. We get the chart as follows.
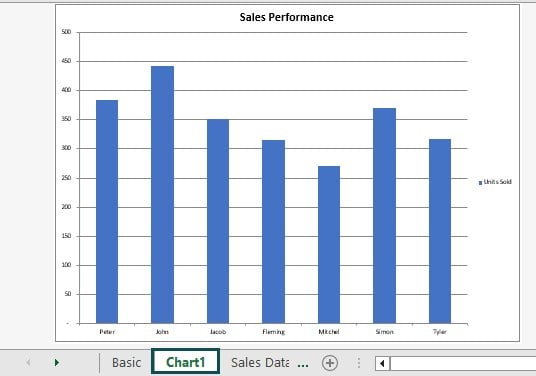
We get the chart in a separate worksheet because we still need to define the chart’s location. Hence, by default, Excel inserts the chart in a brand-new worksheet.
Include All the Properties and Methods of Chart in With Statement
In the above code, each time, we have used the chart variable name “Sales_Chart” to access all the properties and methods associated with the Chart object. However, it is not the best coding practice. We will use the WITH statement to include all the properties and methods associated with the Chart object.Look at the following code.
Sub VBA_Charts_Example1()
Dim Sales_Chart As Chart
Set Sales_Chart = Charts.Add
With Sales_Chart
.SetSourceData Worksheets(“Sales Data”).Range(“A1:B8”)
.ChartType = xlColumnClustered
.ChartTitle.Text = “Sales Performance”
End With
End Sub
As we can see from the yellow-colored code, we have used the variable name once in the WITH statement, and inside it, we have used all the properties and methods associated with the Chart object.
Let’s explore adding the chart in the same worksheet where the data resides.
Example #2 – Create a Chart with the Same Excel Sheet as Shape
We must follow a slightly different approach to insert the chart in the same sheet. Let’s follow the steps listed below.
Step 1: Define a variable to set the worksheet reference.
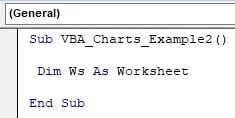
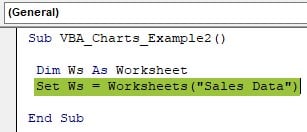
Step 2: Set the targeted worksheet reference to the defined variable where we will insert the eventual chart. In this case, we must insert the chart in the data sheet worksheet, i.e., “Sales Data.”
Step 3: Define a variable to set the Range reference in VBA.

Step 4: Set the data range reference to the Range variable, including the data worksheet.

Step 5: Define a variable of type Object.

Step 6: Set the chart reference for the defined variable as Shape in a target sheet using the worksheet variable Ws.

Step 7: Use the WITH statement and the chart variable name.
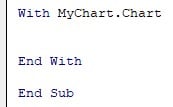
Step 8: Create a chart inside the WITH statement using the code previously used.
Sub VBA_Charts_Example2()
Dim Ws As Worksheet
Set Ws = Worksheets(“Sales Data”)
Dim Rng As Range
Set Rng = Ws.Range(“A1:B8”)
Dim MyChart As Object
Set MyChart = Ws.Shapes.AddChart2
With MyChart.Chart
.SetSourceData Rng ‘Here we are using the data range variable RNG to hold the data range
.ChartType = xlPie ‘We are using the PIE chart
.ChartTitle.Text = “Product-wise Sales Performance”
.ApplyDataLabels
End With
End Sub
Execute the code, and we will get the PIE chart in excel in the same worksheet as a shape.
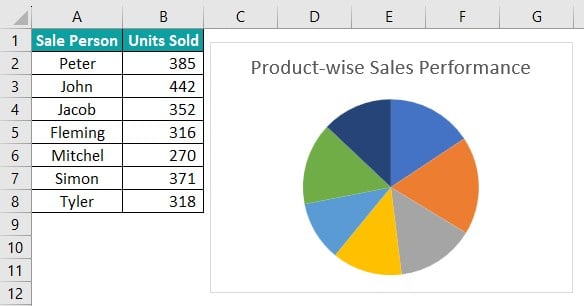
To design the chart better, we use of other properties and methods of the chart and apply the settings as required.
Example #3 – Code to Loop Through Charts
You must have used loops to loop through cells and worksheets. Similarly, loops can loop through all the charts in a workbook. For example, look at the following charts on a sheet.
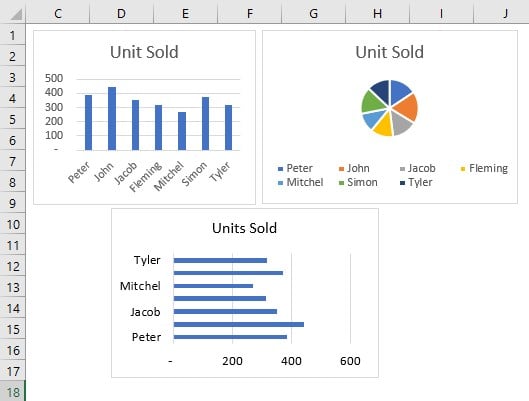
We have three different kinds of charts for the same data and the same worksheet. The one common thing we must change in these three charts is the heading.
To do this simultaneously, we must loop through these worksheets and change the chart title.
Sub VBA_Charts_Example3()
Dim MyChart As ChartObject
For Each MyChart In ActiveSheet.ChartObjects
If MyChart.Name <> “Chart 6” Then
MyChart.Chart.ChartTitle.Text = “Product-wise Sales Performance”
End If
Next MyChart
End Sub
It is a simple loop code we have written. It will loop through all the available charts in the worksheet and change the chart title to “Product-wise Sales Performance.”
Execute the code, and we will see the following change in all the charts.
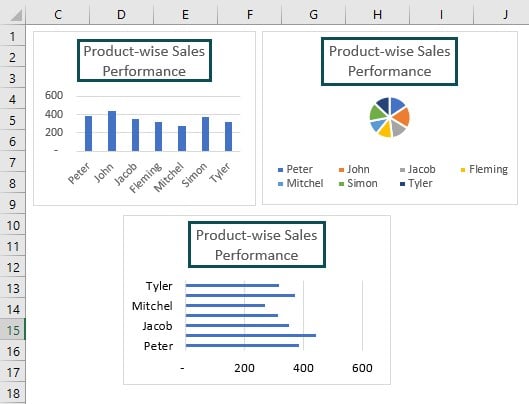
All the charts’ title has been changed to “Product-wise Sales Performance.”
One thing about this loop through all charts is the changes that we make will be the same for all the charts.
However, if we want to ignore a specific chart from changes, we must use the IF logical statement and the chart name to ignore them or include only those charts for making changes.
To view the chart names, go to the HOME tab, under the editing section, and click on the drop down “Find and Select.” Choose the option “Selection Pane”.

It will showcase all the objects in the worksheet and show their names.
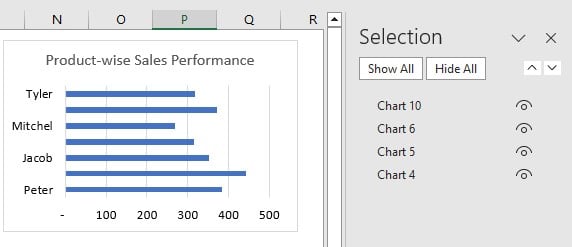
We can double-click on any of the charts and change the chart name.
Assume we do not want to include “Chart6” while changing the header of the chart inside the loop. We write the following code.
Sub VBA_Charts_Example3()
Dim MyChart As ChartObject
For Each MyChart In ActiveSheet.ChartObjects
If MyChart.Name <> “Chart 6” Then
MyChart.Chart.ChartTitle.Text = “Product-wise Sales Performance”
End If
Next MyChart
End Sub
This code will look for the chart name “Chart 6” using the IF logical condition. If the chart name is not equal to “Chart 6,” it will change to “Product-wise Sales Performance.” If the chart name is equal to “Chart 6,” it will not change the title name of the chart.
Example #4 – Alternative Method to Create Chart
As seen, we can create a chart using the Chart object. Another alternative method is by using the Chart object method. The following code will create a chart using the Chart object method.
Sub VBA_Charts_Example4()
Dim Ws As Worksheet
Set Ws = Worksheets(“Sales Data”)
Dim Rng As Range
Set Rng = Ws.Range(“A1:B8”)
Dim MyChart As ChartObject
Set MyChart = Ws.ChartObjects.Add(Left:=ActiveCell.Left, Width:=300, Top:=ActiveCell.Top, Height:=200)
With MyChart.Chart
.SetSourceData Rng ‘Here we are using the data range variable RNG to hold the data range
.ChartType = xlPie ‘We are using the PIE chart
.ChartTitle.Text = “Product-wise Sales Performance”
.ApplyDataLabels
End With
End Sub
The only difference between the previous and current methods is that we have used the “ChartObject” data type here.
In the subsequent step, we set the variable chart property using the chartobject.add method. The rest of the code is the same as the previous one.
Let’s execute the code. We will get the following pie chart.

Important Things to Note
- VBA Charts is an object; if we do not set the object reference using a variable, it will throw an error.
- When we insert a chart, we must provide the data range and the worksheet reference where the data resides.
- When we loop through all the charts in a worksheet, the changes we make will affect all the charts. However, we can exclude specific charts by referring to the chart by its name using the IF logical condition.
- If the data range is not dynamic, and if it increases, the VBA code will still consider only the old data, not the expanded data range. To avoid this, we must use the dynamic range.

Frequently Asked Questions (FAQs)
To create a dynamic chart the code should be able to get the updated data range dynamically. The following code will find the data range dynamically and then use that data range to create a dynamic chart.
Sub VBA_Charts_Example_FAQ()
Dim Ws As Worksheet
Set Ws = Worksheets(“Sales Data”)
‘Find the last used row dynamically
Dim LR As Long
LR = Ws.Cells(Rows.Count, 1).End(xlUp).Row
‘Find the last used column dynamically
Dim LC As Long
LC = Ws.Cells(1, Columns.Count).End(xlToLeft).Column
‘Set the range by using the resize property and variables that hold LR and LC
Dim Rng As Range
Set Rng = Cells(1, 1).Resize(LR, LC)
Rng.Select
Dim MyChart As Object
Set MyChart = Ws.Shapes.AddChart2
With MyChart.Chart
.SetSourceData Rng ‘Here we are using the data range variable RNG to hold the data range
.ChartType = xlPie ‘We are using the PIE chart
.ChartTitle.Text = “Product-wise Sales Performance”
.ApplyDataLabels
End With
End Sub
To move a chart in Excel worksheet, we must use the chart.parent method. The following is an example of moving a chart.
With MyChart.Parent
.Left = Sheets(“Sales Data”).Range(“B1”).Left
.Top = Sheets(“Sales Data”).Range(“B1”).Top
.Width = Sheets(“Sales Data”).Range(“B1:G1”).Width
.Height = Sheets(“Sales Data”).Range(“B1:G10”).Height
End With
To rename a chart, we need to use the variable that holds the chart reference and then use that chart’s “Name” property.
The following code will rename the chart to “Sales Performance Graph.”
MyChart.Name = “Sales Performance Graph”
Both are used to create a chart; however, let’s look at the difference between these two.
Chart Object: An embedded chart requires size and orientation to be set before we move on to other properties and methods of the chart.
Chart: It is an object that does not require anything to be set before we move on to the properties and methods of the chart. It requires just Charts.Add method.
Download Template
This article must help understand the VBA Charts formula and examples. You can download the template here to use it instantly.
Recommended Articles
This has been a guide to VBA Charts. Here we discuss how to create/Add charts in excel using VBA code with examples. You can learn more from the following articles –

Leave a Reply