What Is CHISQ.DIST Excel Function?
The CHISQ.DIST Excel function calculates the probability of the chi-square distribution. This distribution is commonly used in hypothesis testing, particularly when analyzing categorical data. It can be used to study the percentage of some occurrence across samples, like the probability that a number 3 occurs when we throw a dice about 50 times. The cumulative value is calculated with the Cumulative Distribution function (set to TRUE) or the Probability Density function (set to FALSE) values. It comes under the category of Statistical functions.
In the following example, we will calculate the probability of a chi-square value equal to 1 with 1 degree of freedom using the CHISQ.DIST Excel function.
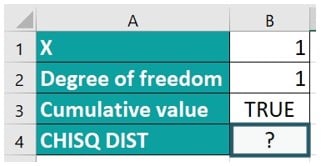
Enter the formula =CHISQ.DIST(B1, B2, TRUE). The result is obtained as shown in the image below.
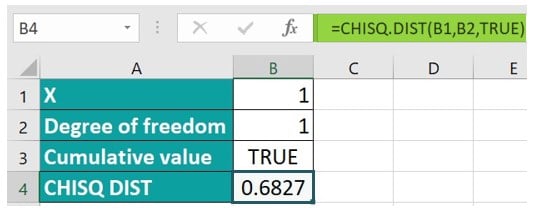
Table of Contents
Key Takeaways
- The CHISQ.DIST function convenience and accuracy for handling chi-square calculations within Excel, adding robustness to statistical analyses.
- The degrees of freedom are calculated for the contingency table. The formula is based on the number of rows and columns. Incorrectly determining the degrees of freedom can lead to erroneous results.
Syntax
- X – (Required) This is the value at which the chi-square distribution is to be evaluated (should be greater than or equal to zero).
- Deg_freedom – (Required) This is the value referred to as the “number of degrees of freedom. ” It is an integer value falling within the range of 1 to 1010.
- Cumulative – (Required) This is a logical value that takes either the value TRUE, which indicates the utilization of the cumulative distribution function, or the value FALSE, indicating the utilization of the probability density function.
How To Use CHISQ.DIST Function in Excel?
To effectively utilize the CHISQ.DIST Excel function, please follow these steps:
#1 – Access from the Excel ribbon
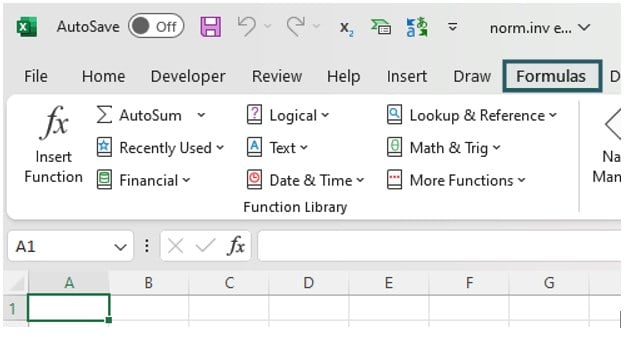
Step 1: Choose an empty cell where you want the result to appear. Go to the “Formulas” tab on the Excel ribbon and click on it.
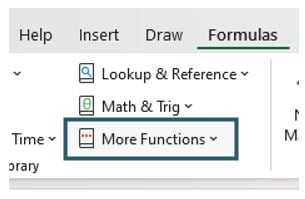
Step 2: From the menu, select the “More Functions” option.
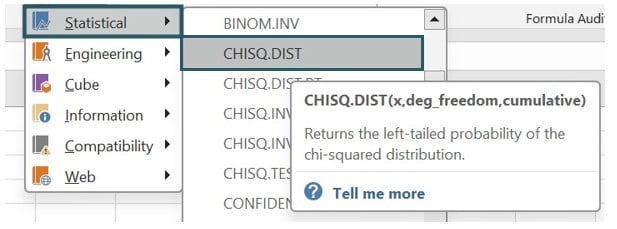
Step 3: In the drop-down list, choose the “Statistical” option. Then, select “CHISQ.DIST” from the subsequent drop-down menu.
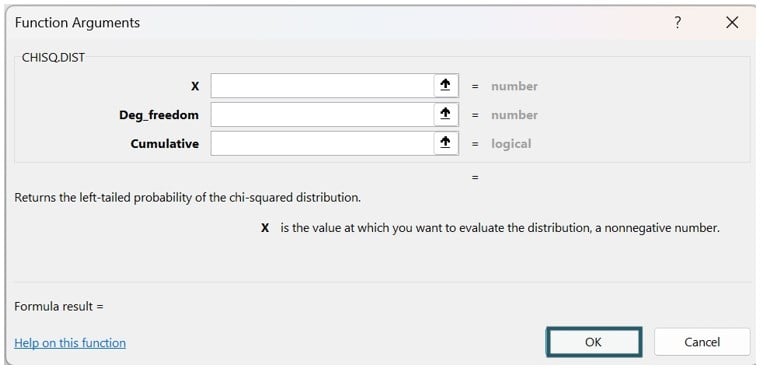
Step 4: A window named “Function Arguments” will appear. Enter the appropriate values for the arguments “x,” “deg_freedom,” and “cumulative.” Once done, click on OK.
#2 – Enter the worksheet manually
Step 1: Select an empty cell where you want the output to be displayed. Type “=CHISQ.DIST()” in the selected cell. Alternatively, you can type “=C” and then double-click on the CHISQ.DIST function from the list of suggestions provided by Excel.
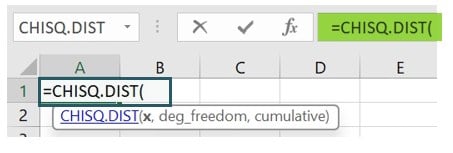
Step 2: Press the “Enter” key to obtain the desired result.

Examples
Given below are some exciting examples of how we can use the CHISQ.DIST Excel function in different ways.
Example #1 – Probability Density Function
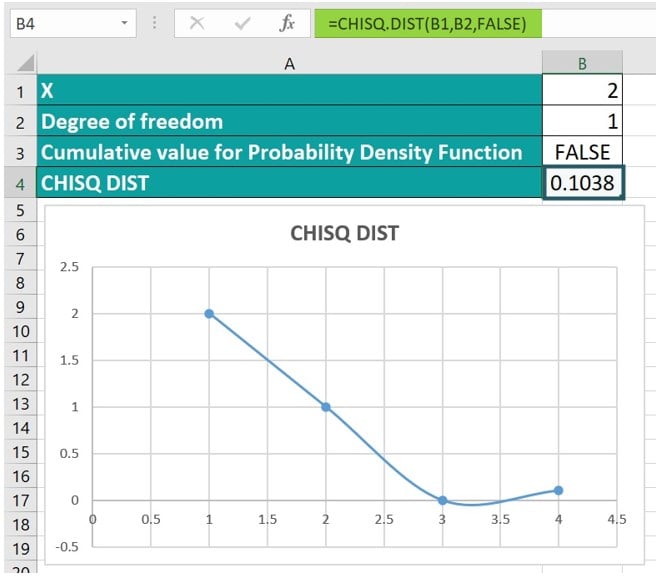
Let’s take a look at an example to understand how the CHISQ.DIST Excel function works. This function can calculate the Probability Density Function with a probability value that is less than or equal to 2 and 1 degrees of freedom. The cumulative value for the Probability Density Function is set to FALSE in this case.

Step 1: Commence by selecting cell B4, where we will input the formula.
Step 2: Input the formula employing the provided values.
=CHISQ.DIST(B1, B2, FALSE)
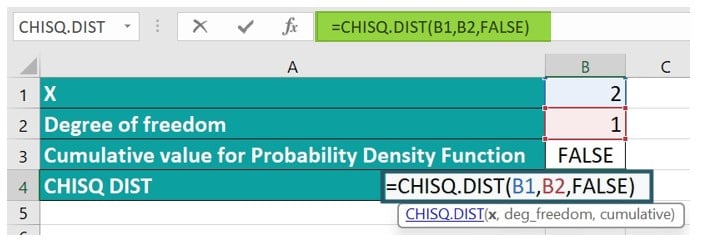
Step 3: Consequently, you will obtain a value of 0.1038, accompanied by a visually graphical representation, as depicted in the image below.
Example #2 – Cumulative Distribution Function
Now that we have seen how to calculate the probability density function in the previous example, we will find the cumulative distribution function in this example. For the uninitiated, the probability density function refers to the probability that a random variable will take a particular value. For instance, when we roll some dice, the probability that each of the numbers might appear after one throw is 1/6.
On the other hand, a cumulative distribution function shows us the probability that a random variable becomes a value less than or equal to x. For example, if we roll some dice once, the probability that we get a number less than or equal to 3 is P(x ≤ 0) = 0, P(x ≤ 1) = 1/6, P(x ≤ 2) = 2/6, P(x ≤ 3) = 3/6.
In this example, we will explore the CHISQ.DIST function to calculate the Cumulative Distribution Function (CDF) with a probability value less than or equal to 5 and 4 degrees of freedom while also keeping the cumulative value for the CDF as TRUE.

To effectively utilize the CHISQ.DIST Excel function, follow these steps:
Step 1: Begin by selecting cell B4, where we will input the formula. Input the formula in the designated cell using the provided values:
=CHISQ.DIST(B1, B2, TRUE)

Step 2: You will obtain a value of 0.7127 as a result, accompanied by a graphical representation, as depicted in the image below.
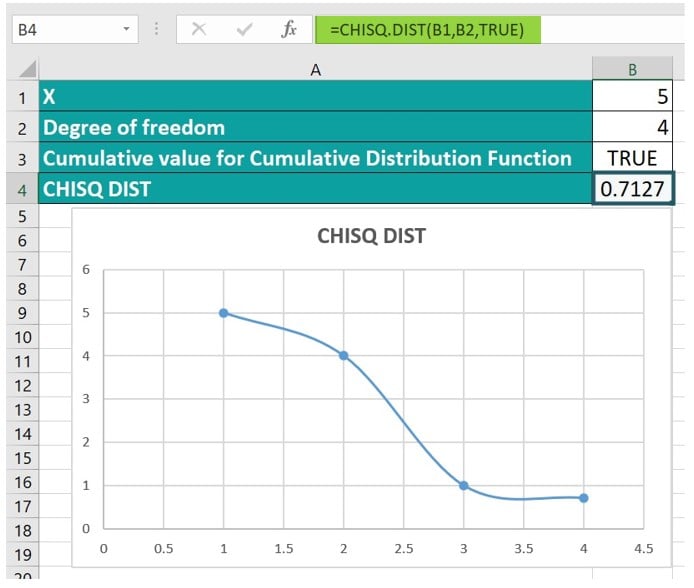
By following these steps, the CHISQ.DIST Excel function calculates the Cumulative Distribution Function accurately.
Example #3
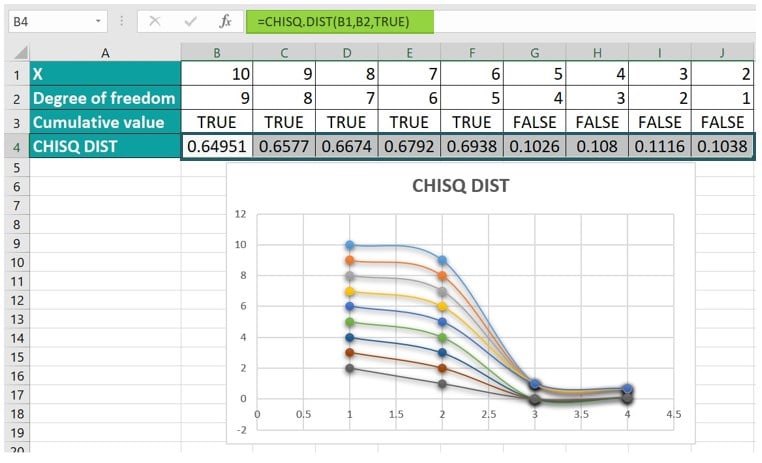
In the following example, we will explore the CHISQ.DIST function in Excel and the calculation of different values of the Probability Density Function (PDF) and Cumulative Distribution function (CDF) with a probability value starting from 10 to 2 and 9 to 1 degree of freedom while also obtaining the cumulative value for the PDF as FALSE and CDF as TRUE.

To effectively utilize the CHISQ.DIST function in Excel, it is crucial to follow these steps:
Step 1: Begin by selecting cell B4, where we will input the formula.
Step 2: Input the formula in the designated cell using the provided values:
=CHISQ.DIST(B1, B2, TRUE)

Step 3: The result will be as shown below, accompanied by a visually appealing graphical representation of the difference in values of x and degree of freedom, as depicted in the image below.
Important Things To Note
- If the deg_freedom argument is not an integer, then MS Excel will truncate the value.
- The #VALUE! error occurs when non-numeric arguments are entered. The #NUM! error occurs when the value of x is negative or the deg_freedom argument falls outside the range of 1 to 1010.
- Ensure that you accurately calculate the degrees of freedom to get the right values.

Frequently Asked Questions (FAQs)
To understand how it works, let us look at an example. We have three sets of values that lead to the # NUM! Error and the # VALUE! Error. We will apply the CHISQ.DIST Excel function and examine the error scenario. 
Enter the formula =CHISQ.DIST(B1, B2, TRUE) in cells B4 to D4, and see the outcomes as stated below.
The chi-squared distribution is a probability distribution that arises in inferential statistics, specifically in hypothesis testing. The probability of the chi-squared distribution denotes the likelihood of obtaining certain values of the chi-squared statistic under different conditions.
The cumulative chi-squared distribution uses degrees of freedom, which reflect the number of categories under consideration. It is derived from the chi-square distribution, which measures the discrepancy between observed and expected frequencies in categorical data.
The CHISQ.DIST function in Excel is used for data analysis and hypothesis testing. Using this function, we can determine the observation of a specific chi-squared value according to the set conditions. It enables statistical significance, such as identifying significant differences between observed and expected frequencies within a dataset. The CHISQ.DIST function carries out complex chi-square tests without having to calculate probabilities manually.
The limitations of using the CHISQ.DIST Excel function are;
• The data used for analysis is independent and random samples from a population-specified distribution. This assumption may not hold correct values.
• The user has to specify the degrees of freedom, which can make it difficult to determine the calculations accurately.
• The CHISQ.DIST does not calculate probability values for one or two-tailed tests separately; it always uses two-tailed tails, leading to incorrect conclusions in hypothesis testing scenarios.
• The function depends on numerical approximation values. Extreme values or data sets with significantly fewer cell counts can result in inaccurate probabilities.
Download Template
This article must help us understand the CHISQ.DIST Excel Function’s formula and examples. You can download the template here to use it instantly.
Recommended Articles
Guide to CHISQ.DIST Excel. Here we learn how to use CHISQ.DIST function in excel with step by step examples using syntax and a downloadable template. You can learn more from the following articles –

Leave a Reply